Europe relies primarily on imports to meet its natural gas needs

Note: Due to reporting requirements, some volumes of pipeline-imported natural gas are not attributed to a source country.
Imports of natural gas by both pipeline and as liquefied natural gas (LNG) provided more than 80% of the supply of natural gas to the countries of the European Union (EU-27) and the United Kingdom (UK) in 2020, up from 65% a decade earlier. During 2020, natural gas imported into the region by pipeline made up 74% of all natural gas imports, and LNG accounted for the remaining 26% of total imports.
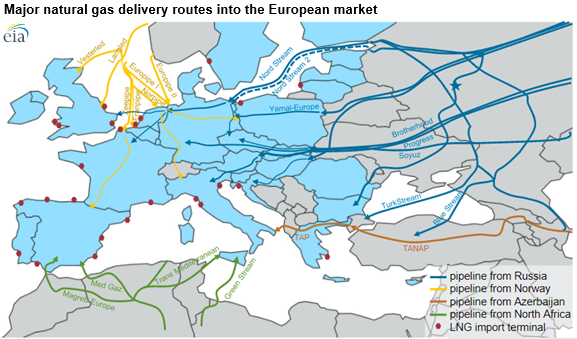
Pipeline imports of natural gas into the region come from Russia, Norway, North Africa, and Azerbaijan. Pipeline imports originating in Russia—the largest supplier in the region—grew from about 11 billion cubic feet per day (Bcf/d) in 2010 to more than 13 Bcf/d in 2020 (a low consumption year due to COVID-19 related impacts). Despite construction of new pipelines, imports from Norway averaged around 9 Bcf/d between 2010 and 2020, as development of new fields in the Barents Sea section of the Norwegian offshore Continental Shelf was insufficient to offset declines from mature fields in the North Sea.
Although LNG imports made up about 26% of all natural gas imports, they provided about 20% of all of the natural gas supplied to the EU-27 countries and the UK in 2020. LNG imports tend to fluctuate from year to year—from as low as 3.6 Bcf/d in 2014 to as high as 10.1 Bcf/d in 2019—depending on global natural gas prices, demand driven by cold weather, and the availability of pipeline supplies. Most LNG delivered to Europe is supplied through long-term contracts. However, growing volumes of flexible LNG supplies, primarily from the United States, contributed to the notable increases in LNG imports to Europe from 2019 to 2021.
Regional production has played a smaller role in supplying European natural gas needs over the past decade. From 2010 through 2020, natural gas production in the EU-27 countries and the UK declined by more than 50%, from 18 Bcf/d in 2010 to 9 Bcf/d in 2020. This decline is the result of resource depletion as well as initiatives to fully phase out natural gas production in the region.
Regional natural gas demand fell rapidly between 2010 and 2014, and then it stabilized during the five-year period from 2016 to 2020 at approximately 45 Bcf/d. Natural gas consumed by the European industrial sector, where fuel switching is difficult, remained nearly unchanged, averaging 13.7 Bcf/d throughout the 2010–2020 period. Energy efficiency measures and electrification reduced residential and commercial sector natural gas consumption to an average of 17 Bcf/d in 2020.
Natural gas consumption in the electric power sector fell the most between 2010 and 2014 as a result of increasing penetration of renewable energy in electricity generation. Starting in 2016, consumption of natural gas in Europe’s electric power sector increased as a result of the systematic retirement of coal-fired power plants across Europe and the retirement of nuclear power plants in Germany in particular.

Principal contributors: Victoria Zaretskaya; Warren Wilczewski