Menu
Crude oil, gasoline, heating oil, diesel, propane, and other liquids including biofuels and natural gas liquids.
Exploration and reserves, storage, imports and exports, production, prices, sales.
Sales, revenue and prices, power plants, fuel use, stocks, generation, trade, demand & emissions.
Energy use in homes, commercial buildings, manufacturing, and transportation.
Reserves, production, prices, employment and productivity, distribution, stocks, imports and exports.
Includes hydropower, solar, wind, geothermal, biomass and ethanol.
Uranium fuel, nuclear reactors, generation, spent fuel.
Comprehensive data summaries, comparisons, analysis, and projections integrated across all energy sources.
Monthly and yearly energy forecasts, analysis of energy topics, financial analysis, congressional reports.
Financial market analysis and financial data for major energy companies.
Greenhouse gas data, voluntary reporting, electric power plant emissions.
Maps, tools, and resources related to energy disruptions and infrastructure.
State energy information, including overviews, rankings, data, and analyses.
Maps by energy source and topic, includes forecast maps.
International energy information, including overviews, rankings, data, and analyses.
Regional energy information including dashboards, maps, data, and analyses.
Tools to customize searches, view specific data sets, study detailed documentation, and access time-series data.
EIA's free and open data available as API, Excel add-in, bulk files, and widgets
Come test out some of the products still in development and let us know what you think!
EIA's open source code, available on GitHub.
Forms EIA uses to collect energy data including descriptions, links to survey instructions, and additional information.
Sign up for email subscriptions to receive messages about specific EIA products
Subscribe to feeds for updates on EIA products including Today in Energy and What's New.
Short, timely articles with graphics on energy, facts, issues, and trends.
Lesson plans, science fair experiments, field trips, teacher guide, and career corner.
EIA is continuing normal publication schedules and data collection until further notice.
Because of lower oil prices in the first year of the COVID-19 pandemic, U.S. operators reported a 19% reduction in proved reserves of crude oil and lease condensate in 2020, according to our Proved Reserves of Crude Oil and Natural Gas in the United States, Year-End 2020 report. Proved reserves totaled 38.2 billion barrels for the year.
Proved reserves are operator estimates of the volumes of oil and natural gas that geological and engineering data demonstrate with reasonable certainty to be recoverable in future years from known reservoirs under existing economic and operating conditions.
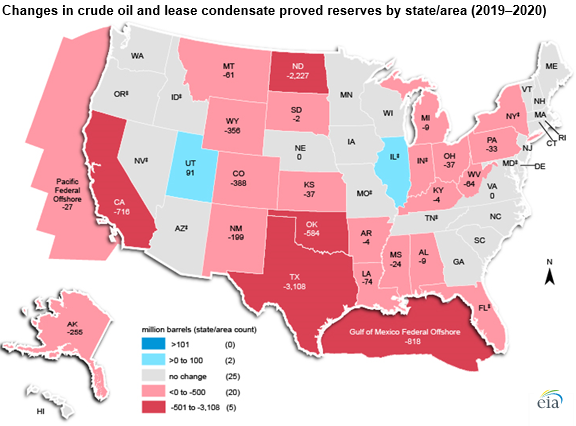
The decline in crude oil and lease condensate reserves in 2020 was largely due to lower crude oil prices: the average annual price of West Texas Intermediate crude oil fell from $57 per barrel (b) in 2019 to $39/b in 2020. Lower crude oil prices caused many operators to revise their estimates of proved reserves downward and scale back development plans for new wells. Higher crude oil prices in 2021 will likely lead to more reserves in 2021.
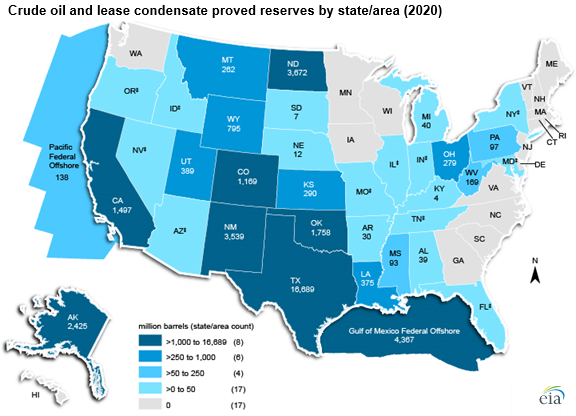
Operators in Texas typically report the most proved reserves of crude oil and lease condensate and did so in 2020, but they also experienced the largest drop in proved reserves in 2020. Production and downward revisions lowered the state’s annual total of proved crude oil and lease condensate reserves by 16%, from 19.8 billion barrels in 2019 to 16.7 billion barrels in 2020. Proved crude oil and lease condensate reserves also fell in North Dakota by 2.2 billion barrels and in the Federal Offshore Gulf of Mexico by 0.8 billion barrels.
Principal contributor: Steve Grape
Tags: reserves, liquid fuels, crude oil, oil/petroleum, map