U.S. Energy Information Administration logo
Skip to sub-navigation
January 31, 2012

Global natural gas production doubled between 1980 and 2010
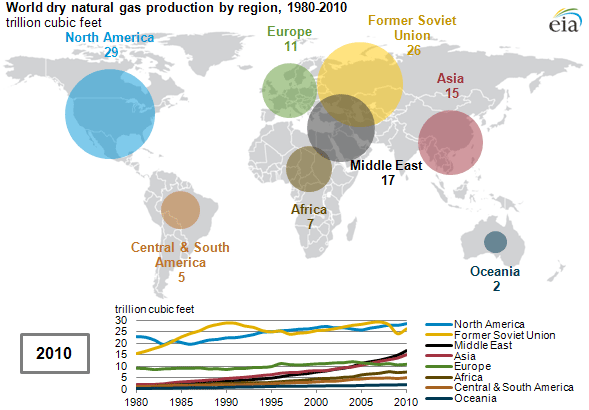
animated map of World dry natural gas production by region, 1980-2010
Source: U.S. Energy Information Administration, International Energy Statistics.
Note: Natural gas production represented by dry natural gas production.

Global dry natural gas production increased 110% between 1980 and 2010, from 53 trillion cubic feet (Tcf) in 1980 to 112 Tcf in 2010. The combined share of North America and the Former Soviet Union—the top two producing regions during the time period—fell from 72% in 1980 to 49% in 2010. While all regions increased natural gas production between 1980 and 2010, the Middle East grew most rapidly, increasing more than eleven-fold.
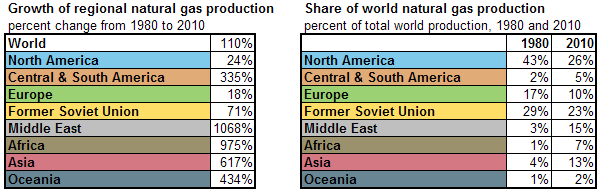
tables of Growth in regional natural gas production and Share of world natural gas production by region, as described in the article text
Source: U.S. Energy Information Administration, International Energy Statistics.
Note: Natural gas production represented by dry natural gas production.
Download CSV Data

Natural gas production in the United States has grown rapidly in the past several years. Rapid increases in U.S. natural gas production from shale gas formations resulted from widespread application of two key technologies: horizontal drilling and hydraulic fracturing.

Shale gas resources, which have recently provided a major boost to U.S. natural gas production, are also available in other regions of the world. An initial assessment of 48 shale gas basins in over 30 foreign countries includes 5,760 Tcf of technically recoverable shale gas resources.

Statistics
Analysis
Tools
Education
News

Petroleum & Other Liquids

Crude oil, gasoline, heating oil, diesel, propane, and other liquids including biofuels and natural gas liquids.

Natural Gas

Exploration and reserves, storage, imports and exports, production, prices, sales.

Electricity

Sales, revenue and prices, power plants, fuel use, stocks, generation, trade, demand & emissions.

Coal

Reserves, production, prices, employment and productivity, distribution, stocks, imports and exports.

Nuclear & Uranium

Uranium fuel, nuclear reactors, generation, spent fuel.

Renewable & Alternative Fuels

Includes hydropower, solar, wind, geothermal, biomass and ethanol.

EIA Survey Forms

Forms EIA uses to collect energy data including descriptions, links to survey instructions, and additional information.

Total Energy

Comprehensive data summaries, comparisons, analysis, and projections integrated across all energy sources.

U.S. States

State energy information, including overviews, rankings, data, and analyses.

International

International energy information, including overviews, rankings, data, and analyses.

Environment

Greenhouse gas data, voluntary reporting, electric power plant emissions.

Data Tools, Apps, & Maps

Tools to customize searches, view specific data sets, study detailed documentation, and access time-series data.

Open Data

EIA's free and open data available as API, Excel add-in, bulk files, and widgets

EIA Beta

Come test out some of the products still in development and let us know what you think!

Open Source Code

EIA's open source code, available on GitHub.

RSS Feeds

Subscribe to feeds for updates on EIA products including Today in Energy and What's New.