New Northeast natural gas pipeline capacity comes on-line
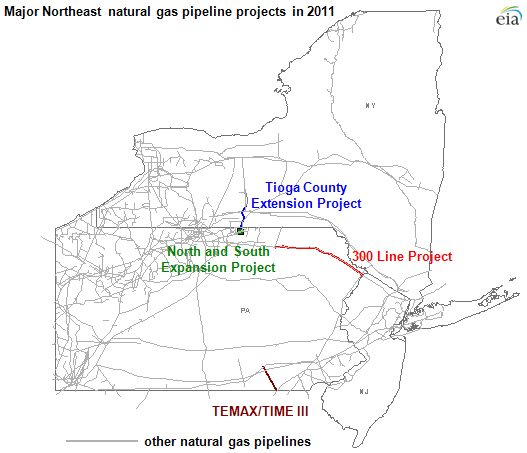
Four interstate natural gas pipeline projects in the Northeast U.S. began commercial service in 2011, adding nearly 1.5 billion cubic feet per day of capacity (see map) and over 181 miles of new pipe. Average daily natural gas demand last winter (November 2010 - March 2011) in the Northeast was about 16 billion cubic feet per day.
Recently, new Northeast pipeline capacity and a warmer-than-normal winter weather outlook have reduced the potential for pipeline constraints along the Northeast seaboard for the 2011/2012 winter. Despite these pipeline capacity increases, forward markets such as NYMEX ClearPort still reflect premiums of over $2 per million British thermal units (MMBtu) over the expected NYMEX natural gas futures contract in February at the Transco Zone 6 trading point. This signals that additional natural gas pipeline capacity may be needed to reduce peak winter premiums further in the big winter load centers like New York City and Boston that remain subject to pipeline constraints.
Natural gas pipeline projects starting service in the Northeast in 2011 include:
- TEMAX/TIME III, operated by Texas Eastern Transmission, began service on August 26, 2011. This 39-mile pipeline and compression expansion added 455 million cubic feet per day (MMcfd) of capacity from Clarington, Ohio to York County, Pennsylvania.
- 300 Line Expansion Project, operated by Tennessee Gas Pipeline Company, began service on Nov 1, 2011. This 127-mile looping and compression expansion added 350 MMcfd of capacity from northern Pennsylvania to northern New Jersey. Since it began operations Tennessee has increased its receipts of Marcellus natural gas on its system.
- Tioga County Extension Project, operated by Empire Pipeline, began service on November 21, 2011. This 15-mile pipeline expansion increases northeast Marcellus natural gas take-away capacity by 350 MMcfd to central New York.
- North and South Expansion Project, operated by Inergy Midstream, began service on November 1, 2011. The installed compressors added 325 MMcfd of incremental capacity between receipt and delivery points at the interconnects with the Millennium Pipeline and Tennessee Gas Pipeline.
Among the projects the 300 Line Expansion Project has had the biggest influence on the winter 2011/2012 market, so far. Natural gas flows from northern Pennsylvania into the Tennessee Gas Pipeline's system were averaging about 540 million cubic feet per day higher from January 1, 2012 through January 12, 2012 compared to average flows in October 2011 or flow just prior to the start of service for the expansion. As a result, current spot prices in northern Pennsylvania at the InterContinentalExchange TGP Zone 4 Marcellus trading point reflect parity with the Henry Hub. Prior to service starting on the 300 Line Expansion Project, the spot natural gas price at TGP Zone 4 Marcellus averaged only $1 per MMBtu, which is a discount of more than $2 per MMBtu compared to the Henry Hub spot price. Previously, TGP Zone 4 Marcellus prices were held back due to limitations in flowing growing Marcellus natural gas production into the Tennessee Natural Gas Pipeline.