EIA’s Hourly Electric Grid Monitor provides timely data about electricity usage patterns
From December 18 through December 31, Today in Energy will feature a selection of EIA product highlights and some of our favorite articles from 2020. Today’s article was originally published on April 6.
The U.S. Energy Information Administration’s (EIA) Hourly Electric Grid Monitor provides up-to-the-hour information showing electricity demand across the U.S. electric grid. Large-scale events that affect normal routines, from expected occurrences such as major holidays to unexpected situations such as the current COVID-19 pandemic, can change the pattern of electricity usage in the country.
The grid monitor is updated every hour with electricity demand for the previous hour. Hourly demand forecasts are available every morning at about 10:00 a.m. Eastern Time for the current day. Hourly electricity generation and total interchange data are available with a one-day lag, and hourly interchange between neighboring balancing authorities is available with a two-day lag. Sub-regional demand data for the largest balancing authorities are available with a one- to two-day lag. Most of the grid monitor’s data are available back to July 1, 2015, except generation by energy source and sub-regional demand data, which are available back to July 1, 2018.
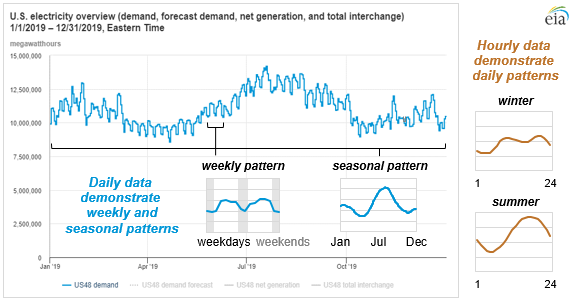
Hourly electricity data are a valuable resource for understanding all of the daily, weekly, seasonal, and regional usage patterns woven into overall U.S. electricity consumption. Divergences from these typical patterns can indicate the impact of current events; however, isolating these impacts from other factors such as weather can be challenging.
The biggest drivers of U.S. electricity demand are temperature, time of day, and day of week. Electricity demand is highest in the summer, which has a distinct single-peak load shape, and winter demand typically has separate morning and evening peaks. Spring and fall demand can be particularly volatile when temperatures swing significantly from week to week. Weekend U.S. electricity demand tends to be lower than weekday demand because schools and many businesses are closed, although this pattern is often reversed when changes in weather coincide with certain days of the week.
The Hourly Electric Grid Monitor allows users to create, save, and share custom dashboards, which they can use to monitor new developments. EIA has created three custom dashboards that provide overviews of current conditions:
- Rolling 90 days of daily electricity demand for the United States and regions
- Rolling 14 days of hourly electricity demand for the United States and regions
- Rolling 5 days of daily load shapes for the United States and regions
EIA collects the data for the Hourly Electric Grid Monitor through automatic feeds under its Form EIA-930, Hourly and Daily Balancing Authority Operations Report. Some additional considerations to keep in mind when using this data include
- The electricity demand data are not disaggregated by sector (residential, industrial, commercial, and transportation). Large industrial facilities, such as automobile manufacturing plants, tend to consume electricity at a stable level throughout the day. When they close, there may be an overall decrease in total electricity demand. Electricity consumption data by sector are available on a monthly basis in the Electric Power Monthly (Chapter 5) and the Form EIA-861M data files.
- The electricity demand data do not include demand served directly by distributed generation resources, which include both small-scale distributed resources (such as rooftop solar photovoltaic (PV) systems) and large-scale resources at industrial and commercial facilities. The electricity generation data include the metered output of generation resources that are managed directly by the balancing authority or whose operations are visible to the balancing authority. EIA’s Electric Power Monthly includes monthly data on generation from all large-scale resources in the United States and estimated generation from small-scale distributed solar resources. Form EIA-923 data files provide monthly generation data for large-scale resources at the power plant level.
- The data are collected on an as is basis directly from balancing authorities using automated processes, and they are published in real time, which can result in anomalous data values. EIA continuously works with respondents to correct anomalous values for the historical record.
Even though the COVID-19 situation continues to evolve in the United States, grid operators have seen not only reduced weekday electricity demand relative to expectations for this time of year and current weather but also changes in daily electricity usage profiles. A forthcoming Today in Energy article will provide more analysis of the impacts of COVID-19 on U.S. electricity demand.
In the past few weeks, several regional transmission organizations (RTOs) and independent system operators (ISOs) have reported less electricity demand and a delay in the morning increase (ramp) as schools, workplaces, and businesses have closed to slow the spread of COVID-19.

Source: U.S. Energy Information Administration, Hourly Electric Grid Monitor
On March 25, the New York ISO (NYISO) reported that
“from 6 to 10 a.m., a time when energy use typically ramps up as New Yorkers arrive at work, we are seeing a delay in the timing of the ramp and a reduction in usage of 6 to 9% relative to typical load patterns. That means energy load is increasing later in the day than normally expected and remaining at a lower level.”

Source: U.S. Energy Information Administration, Hourly Electric Grid Monitor
PJM, the grid operator of an electric system spanning 13 states and the District of Columbia, reported on March 23 that
“March 17-19 show the morning peak arriving one to two hours later than forecast models typically predict - shifting from about 8 a.m. to 9-10 a.m., with the evening peak approximately 5 percent lower than expected. The load curve also is flatter, without the same fluctuations usually shown by morning and evening peaks and valleys, when people are preparing for work in the morning or dinner at night.”

Source: U.S. Energy Information Administration, Hourly Electric Grid Monitor
Although California ISO’s (CAISO’s) load shape has not shifted as noticeably as other regions, its overall electricity demand has decreased substantially during the past few weeks.
EIA’s Hourly Electric Grid Monitor also allows users to monitor trends in regions of the country that are not managed by an RTO or ISO, such as the Northwest, Southwest, and Southeast regions. Data from Seattle City Light (SCL), near where the first confirmed case of COVID-19 in the country occurred, and Portland General Electric (PGE) show a similar delay and flattening of the typical morning ramp in recent weeks.

Source: U.S. Energy Information Administration, Hourly Electric Grid Monitor
Note: Two anomalous data values were excluded from the 2017 data.

By combining the demand reported by all balancing authorities, the grid monitor provides total electricity demand for the entire Lower 48 states.

EIA continues to welcome feedback about the Hourly Electric Grid Monitor, which is currently in beta version and will eventually replace the existing U.S. Electric System Operating Data tool.
Principal contributors: EIA staff