
U.S. power customers experienced an average of nearly five hours of interruptions in 2019
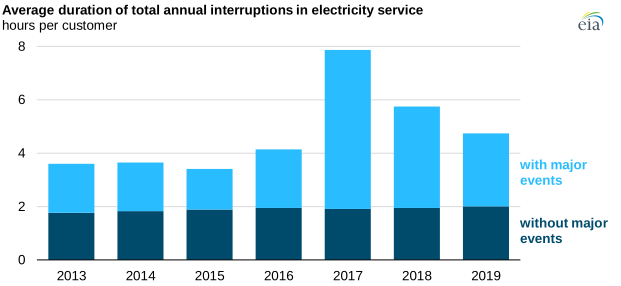
Interruptions in electricity service to customers vary in frequency and duration across the nearly 3,000 electric distribution systems that serve about 155 million customers in the United States. In 2019, U.S. customers experienced an average of 3.2 hours of interruptions during major events and 1.5 hours of interruptions without major events, or nearly 5 hours total.
Many factors cause power interruptions, including weather, vegetation patterns, and utility practices. Utilities can report interruption duration values with major events (such as snowstorms or hurricanes), without major events, or both.
Including major events, the average interruption of 4.7 hours (284 minutes) in the United States during 2019 was nearly half the average interruptions experienced in 2017, a year with more hurricanes, wildfires, and severe storms. Excluding major events, the average duration of interruptions customers experienced was 1.5 hours (92 minutes), relatively consistent with previous years.
One metric used to measure the reliability of U.S. electric utilities is the System Average Interruption Duration Index (SAIDI), which measures the total time an average customer experiences a non-momentary power interruption in a one-year period. For utilities that report SAIDI metrics using Institute of Electrical and Electronics Engineers (IEEE) standards, non-momentary interruptions are those lasting longer than five minutes. SAIDI is often paired with the System Average Interruption Frequency Index (SAIFI), an index that measures the frequency of interruptions.
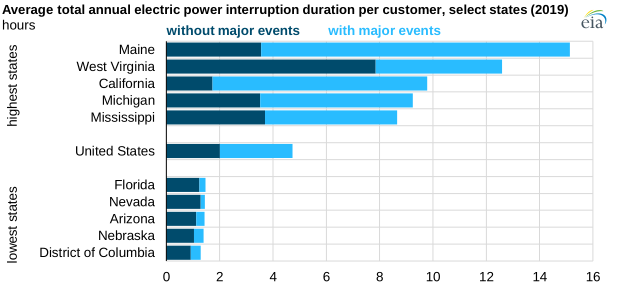
Electricity customers in the District of Columbia, Nebraska, Arizona, Nevada, and Florida had the shortest total time interrupted in 2019. Their average total annual interruption time ranged from 77 minutes in the District of Columbia to 88 minutes in Florida.
Customers in Maine, West Virginia, California, Michigan, and Mississippi experienced the longest total time interrupted in 2019. In these states, the long power interruption durations were caused by major events such as winter storms (in Maine) or wildfires (in California).
In addition, Maine and West Virginia are heavily forested states where power interruptions resulting from falling tree branches are common. The average customer interruption time in these five states in 2019 ranged from almost 7 hours in Mississippi to more than 15 hours in Maine.
The U.S. Energy Information Administration (EIA) explains these electricity reliability metrics further in a video guide on SAIDI and SAIFI data reporting, and these metrics are available in EIA’s Annual Electric Power Industry Report.
Principal contributors: Sara Hoff, Anodyne Lindstrom
Tags: electricity, outages