
Global liquid fuels production outages have increased in 2020
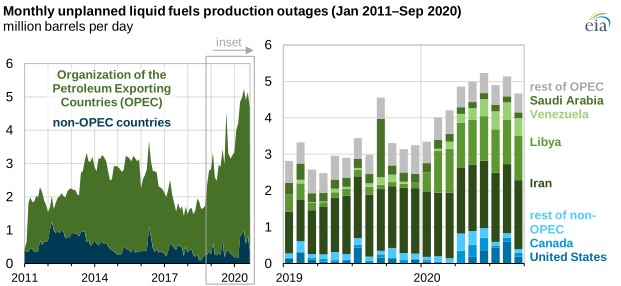
Note: Non-OPEC production outages include crude oil and condensate. OPEC production outages are for crude oil only.
Disruptions to crude oil and condensate production from members of the Organization of the Petroleum Exporting Countries (OPEC) and non-OPEC countries have risen considerably since last year. These outages have contributed to reduced liquid fuel supply and, along with crude oil production declines agreed to among OPEC and partner countries (OPEC+), have contributed to global liquid fuels inventory draws since June.
So far in 2020, monthly oil supply disruptions have averaged 4.6 million barrels per day (b/d) and reached 5.2 million b/d in June, the highest monthly levels since at least 2011, when the U.S. Energy Information Administration (EIA) began tracking monthly liquids production outages. Global oil supply disruptions averaged 3.1 million b/d in 2019, and rising outages in Iran have been the main drivers of the year-on-year increase. EIA does not include field closures for economic reasons or oil demand declines in its accounting of supply disruptions.
Libya, Venezuela, and Iran (the OPEC countries exempt from the latest OPEC+ agreement) were the main contributors to these outages. Domestic political instability in Libya has removed about 1.2 million b/d from oil production since February 2020. The Libyan National Army, the warring faction in eastern Libya, blockaded five of the country’s oil export terminals and shut in oil production from major fields in the southwestern region in January 2020, causing Libya’s production to fall to less than 100,000 b/d by April.
U.S. sanctions have led to production outages in Venezuela and Iran. U.S. sanctions placed on oil-trading companies and shipping companies that facilitated exports of Venezuela’s crude oil in the first half of 2020 removed 500,000 b/d of crude oil production from global markets by August. Ongoing U.S. sanctions on Iran’s crude oil and condensate exports have kept Iran’s disruption levels elevated through 2020, and disruptions there have increased by another 100,000 b/d since January.
Non-OPEC oil supply disruptions, mostly from the United States and Canada, rose to nearly 800,000 b/d in August. Disruptions in Canada occurred when operators ordered nonessential staff to stop work because of coronavirus outbreaks at production sites. In the United States, hurricane-related disruptions and unplanned maintenance affected oil production this summer. Other non-OPEC countries experienced temporary field closures for various reasons such as coronavirus outbreaks among workers, logistical issues moving workers or equipment during the pandemic, fires at field operations in Canada, or other natural disasters.
EIA publishes historical unplanned production outage estimates in its Short-Term Energy Outlook (STEO). In its estimates of outages, EIA differentiates among declines in production resulting from unplanned production outages, permanent losses of production capacity, and voluntary production cutbacks. EIA’s estimates of unplanned production outages are calculated as the difference between estimated effective production capacity (the level of supply that could be available within one year) and estimated production.
Principal contributors: Candace Dunn, Eric Han
Tags: production/supply, outages, OPEC, liquid fuels, crude oil, oil/petroleum