
EIA’s mapping system and data series show energy infrastructure near hurricanes, wildfires
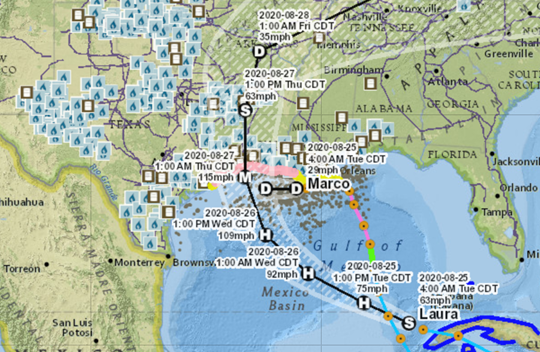
Tropical Storms Marco and Laura are in or approaching the U.S. Gulf Coast region, home to key U.S. energy infrastructure, and several wildfires are affecting large areas of California and Colorado. Both the storms and fires could affect local energy supply and demand, especially for transportation fuels and electricity. The U.S. Energy Information Administration’s (EIA) Energy Disruptions map shows storm and fire-related geographic data (also referred to as map layers) from the National Hurricane Center and the National Weather Service and EIA's map layers for energy-related infrastructure such as high-voltage transmission lines, power plants, and petroleum bulk terminals.
Fire-affected areas, which appear as red flag warnings or air quality alert areas in the map layers, currently cover parts of Northern California, Nevada, Oregon, Washington, and Idaho. Several fires have also affected parts of western and northern Colorado, one of the largest energy-producing states in the country.
EIA also publishes key production, consumption, and operational status information on its website. Notably, EIA collects hourly electric load data for each of the 64 active balancing authorities in the Lower 48 states and publishes these data in the U.S. Hourly Electric Grid Monitor. The effects of tropical storms, hurricanes, and wildfires on electric load may become apparent in the data as long as balancing authorities can transmit information to EIA. For example, in September 2017, widespread outages following the landfall of Hurricane Irma resulted in electricity demand in Florida falling to 64% lower than typical levels for that time of year.
EIA’s Nuclear Outages status page maintains the daily status of each of the nation’s 57 nuclear power plants, based on status reports the Nuclear Regulatory Commission receives. Louisiana has two nuclear power plants: Waterford Unit 3, located near New Orleans, was operating at full capacity as of August 24, and the River Bend nuclear power plant, located farther inland, has been shut down since August 22. Texas has one nuclear plant on the Gulf Coast, the South Texas Project, which as of the morning of August 24 was operating at full capacity.
EIA collects and publishes transportation fuels data regionally at the Petroleum Administration for Defense District (PADD) level. As discussed in EIA's study of transportation fuel markets in the East Coast and Gulf Coast, the Gulf Coast is a key region for U.S. petroleum infrastructure because it contains more than half of the U.S. petroleum refining capacity.
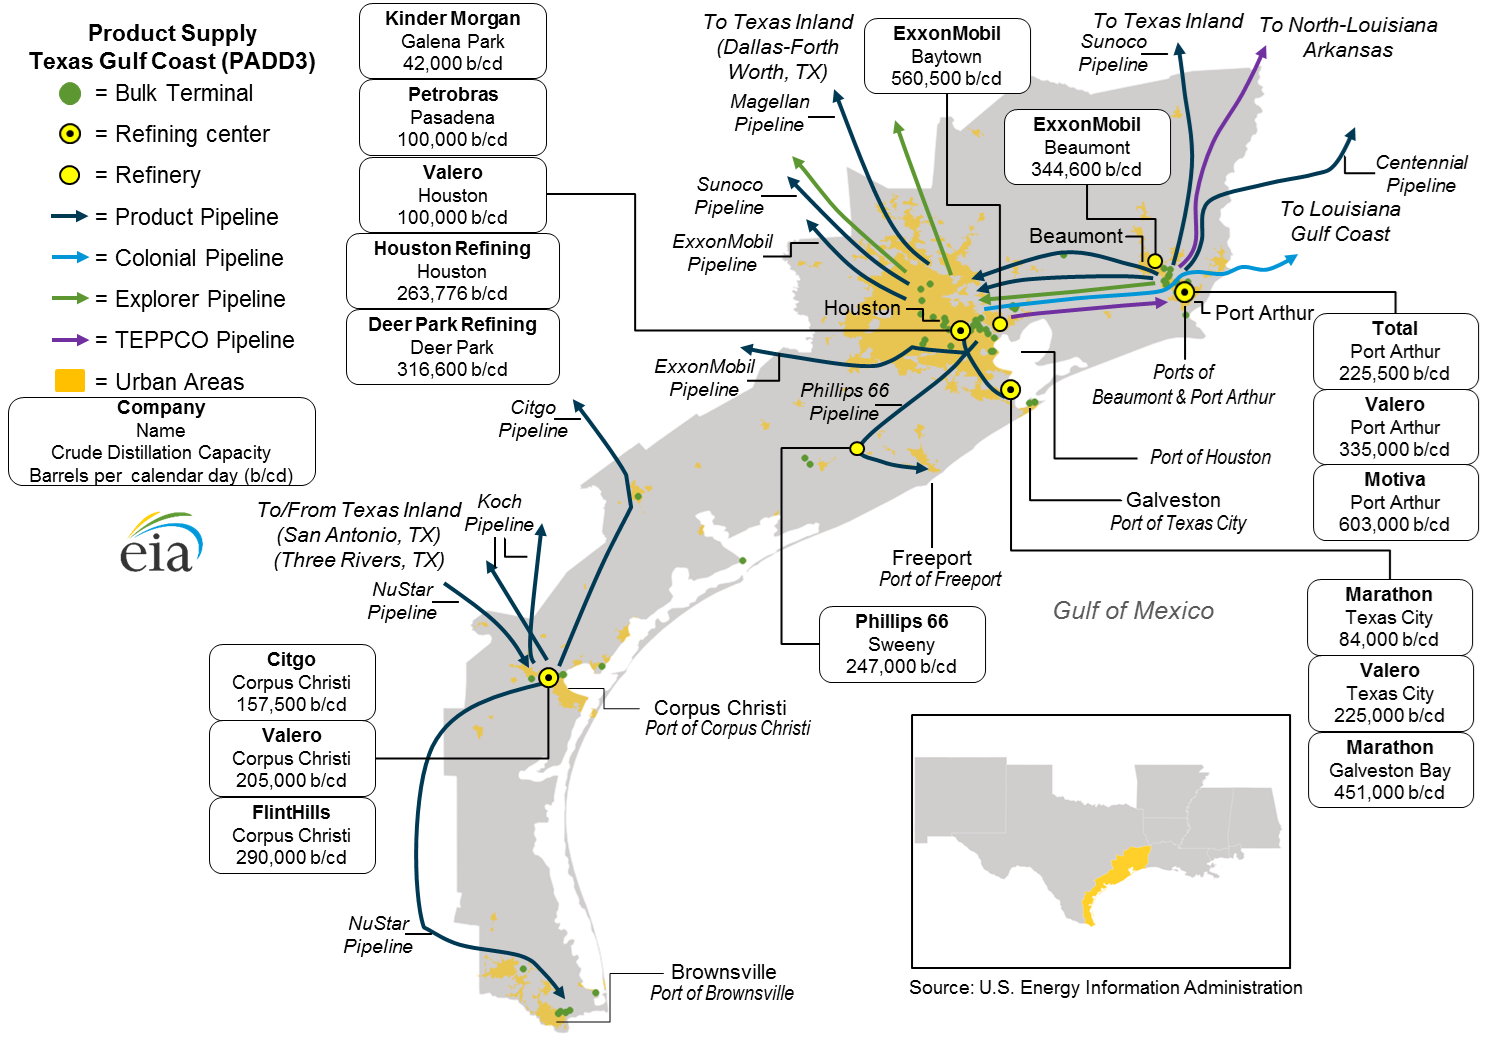
Source: U.S. Energy Information Administration, East Coast and Gulf Coast Transportation Fuels Markets
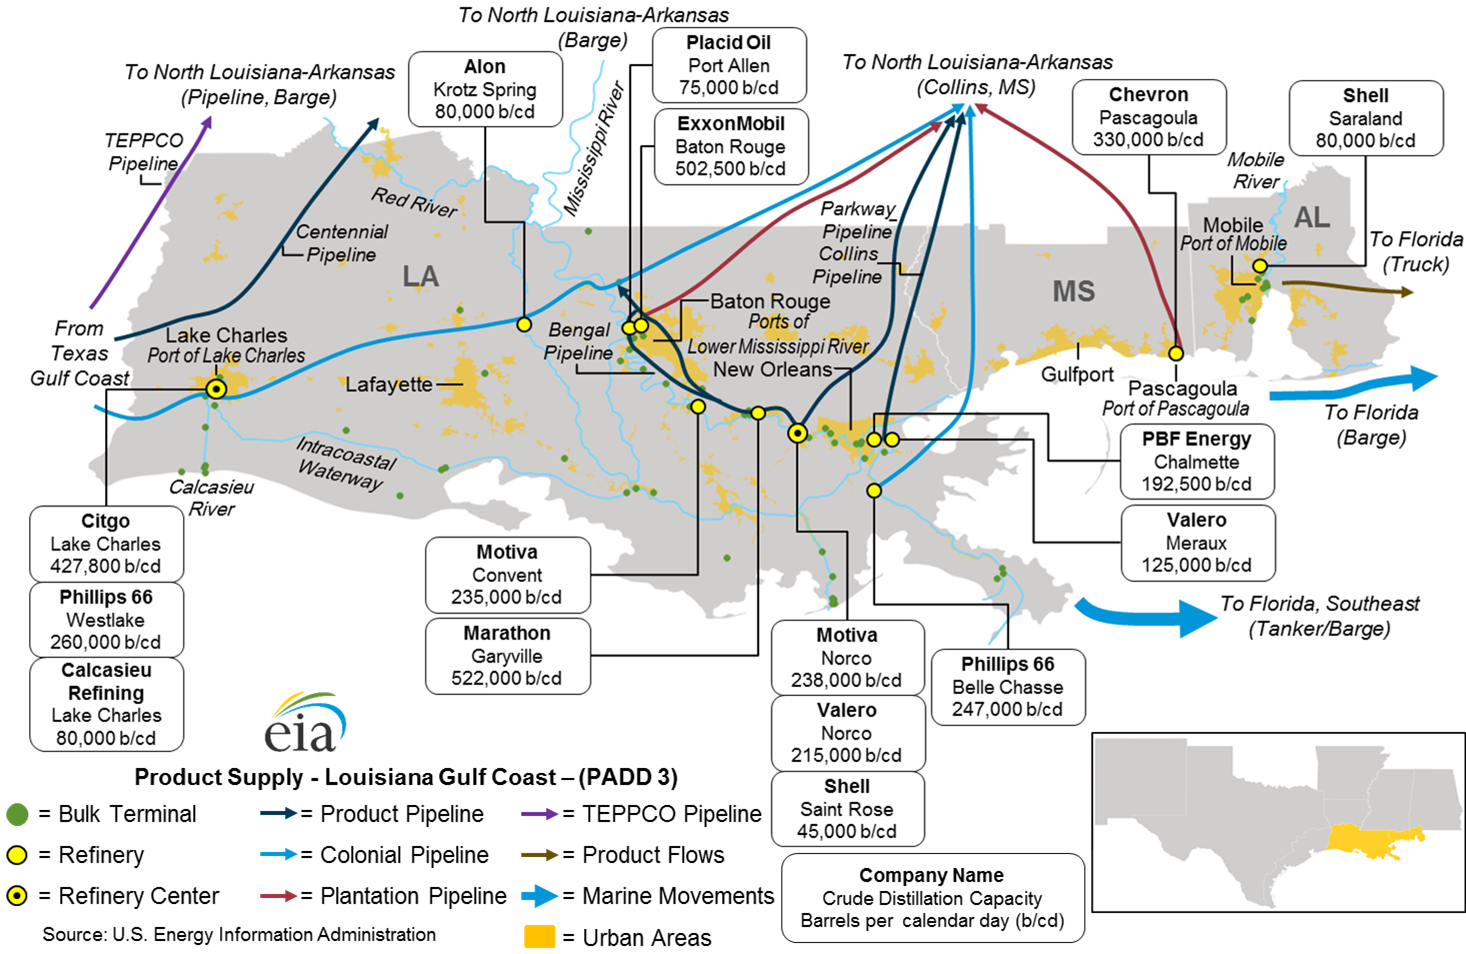
Source: U.S. Energy Information Administration, East Coast and Gulf Coast Transportation Fuels Markets
Typically, demand for transportation fuels increases rapidly in the days before the arrival of a hurricane in the affected areas as consumers purchase fuel to prepare for evacuation. This rapid, unexpected increase in demand puts pressure on local inventories because the rest of the supply chain has not had time to respond. State and local governments have issued disaster declarations and evacuation orders for several parishes in Louisiana and counties in Texas.
EIA’s Weekly Petroleum Status Report provides the most recent weekly estimates of regional petroleum markets. As of the week ending August 14, the Gulf Coast region had 89.3 million barrels of motor gasoline, or about 13% higher than the five-year (2015–19) average for mid-August. Inventories for motor gasoline and other transportation fuels are higher than normal because of the rapid decline in transportation fuel demand since mid-March that has largely persisted as many parts of the United States remain under travel restrictions and other efforts to mitigate the spread of coronavirus.
Principal contributors: Owen Comstock, Hannah Breul
Tags: weather, disruption, map