Current natural gas forward prices signal rising—but still low—prices in 2012
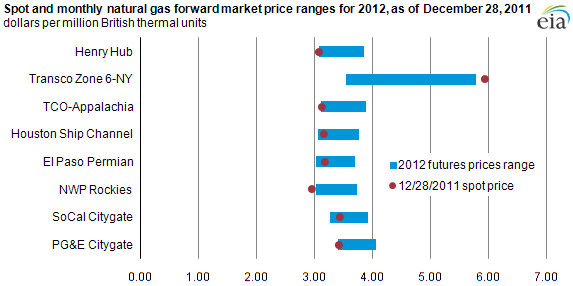
Note: Forward prices are derived each month (January-December) by adding the locational basis swap to the NYMEX Henry Hub futures price for the given month at each location. The ranges reflect the minimum and maximum monthly price for months in 2012. For example, a January 2012 NYMEX Henry Hub futures contract valued at $3.50/MMBtu and a January 2012 Transco Zone 6-NY basis swap valued at $2.50/MMBtu would yield a $6.00/MMBtu price at Transco Zone-6 NY.
Natural gas forward market prices (as of December 28, 2011) signal a continuation of low natural gas prices into 2012. Winter 2011-2012 forward prices were recently the lowest in over ten years, and, of the eight trading points identified, only Transco Zone 6-NY (New York City) and PG&E Citygate (Northern California) show 2012 forward monthly price ranges that include prices above $4/MMBtu. Natural gas spot prices remained low throughout 2011 relative to prior years, reaching a two-year low in November. The spot natural gas price at Transco Zone 6 New York, shown in the graph, is above next year's average monthly trading ranges due to recent cold weather-driven demand. Current spot natural gas prices are lower than the 2012 forward contract range at several natural gas trading points identified in the chart.
The natural gas price at the Henry Hub in Louisiana informs much of the rest of the country, with prices largely following price movements at Henry. Similarly, forward prices, except for the Northeast (represented here by the Transco Zone 6-NY trading point), closely mirror 2012 forward prices at the Henry Hub. Northeast gas prices behave differently, with spot and forward prices higher during colder months due to expectations regarding pipeline constraints in transporting natural gas to the Northeast during times of high natural gas demand.
Tags: futures, map, natural gas, prices, spot prices