
A quarter of California's electricity comes from outside the state
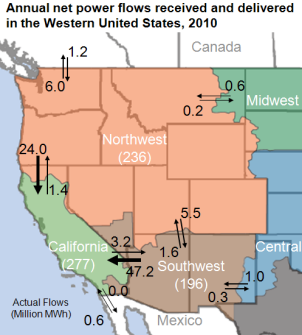
Note: The California region shown includes the California ISO, Los Angeles Department of Water and Power, the Sacramento Municipal Utility District, the Turlock Irrigation District and the Imperial Irrigation District. Other systems operating in the state are not included in the California region.
Download CSV Data
Net power flows into California from other Western States accounted for about 67 million megawatthours (MWh), or 25% of California's total electric supply of 277 million MWh in 2010 (see map). California received—on net basis (power flows into the state minus power flows out of the state)—44 million MWh from the Southwest and 22.5 million MWh from the Northwest in 2010. Interregional power flows elsewhere in the West were much lower.
In the map above, the numbers in white under the region names are the total annual demand for electricity in the region for 2010. The black numbers next to the arrows represent annual net flows of electricity received and delivered between regions measured in millions of megawatthours for 2010.
FERC's Form 714 collects from all U.S. balancing authorities (electric systems) the monthly and annual sums of net generation, net actual interchange, net energy for load (demand), and the annual sum of hourly actual interchange (flows) received from and delivered to other neighboring balancing authorities. The data shown on the map are an aggregation of this balancing authority-level data into regions.

The West receives very small amounts of power from the East. The East and the West operate as separate electric systems, called Interconnections. The ties between the transmission systems in the East and West have very limited capacity for power transfers. The significance is that the Eastern and Western interconnections (and a third interconnection covering most of Texas) are for most purposes electrically isolated from each other. Each interconnection is operated independently, and trade between the interconnections across the direct current ties is minimal.

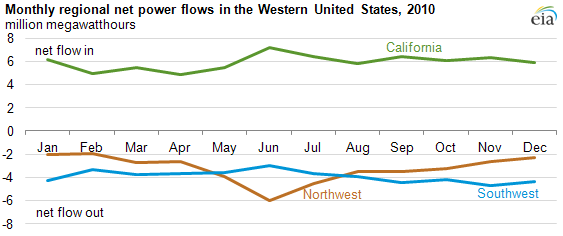
While the map shows annual data, some of the flows in the West are seasonal. For instance, the hydroelectric capacity in the Pacific Northwest generates large amounts of electricity (and therefore large transfers to other regions). River flows and hydroelectric generation are typically highest in spring and early summer.
The chart shows increased flows out of the Northwest in May, June, and July of 2010. This coincides with increased receipts of power in California as the low-cost hydroelectric power displaces electricity generated from more expensive generators. Some of the displaced generators are located in the Southwest as the outflow of power from this region drops during these months. At other times of the year, power from the generators in the Southwest flowing out of the region increases to offset the diminished flows coming from the Northwest.
Download CSV Data