
U.S. crude oil inventories are approaching record-high levels
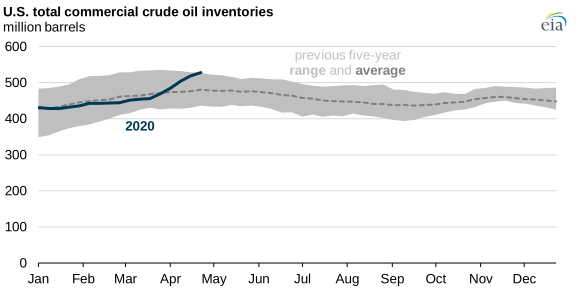
Recent declines in demand for petroleum products have contributed to record increases in U.S. commercial crude oil inventories. Transportation fuel demand has decreased as a result of reduced economic activity and stay-at-home orders aimed at slowing the spread of the 2019 novel coronavirus disease (COVID-19). Refiners have been able to reduce the amount of material they run through refineries (as measured by gross inputs, which includes crude oil, unfinished oils, and natural gas plant liquids) relatively quickly in response to falling demand, but crude oil production has not responded as quickly, leading to large crude oil inventory increases.
From March 13 (when a national emergency was declared in the United States) to April 24, U.S. commercial crude oil inventories increased by 74 million barrels (16%) and are now 8 million barrels below the record-high value set in March 2017, according to data in the U.S. Energy Information Administration’s (EIA) weekly series that dates back to 1982. Commercial crude oil inventories for the week ending April 10 increased by 19.2 million barrels, the largest weekly change in EIA’s data.
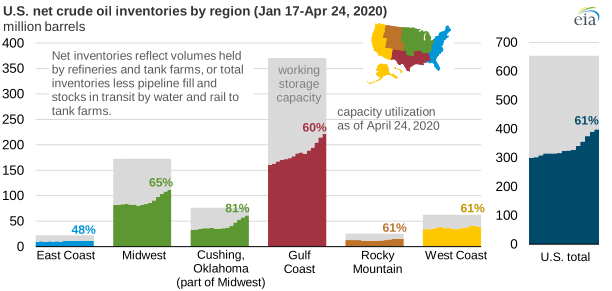
The U.S. Gulf Coast region, home to more than half of U.S. refining capacity, typically has the most crude oil inventories. From March 13 to April 24, Gulf Coast inventories increased by 36.4 million barrels (20%) to 221.6 million barrels. The increase of 10.2 million barrels in the week ending April 10 was the fourth-largest increase in the Gulf Coast region on record.
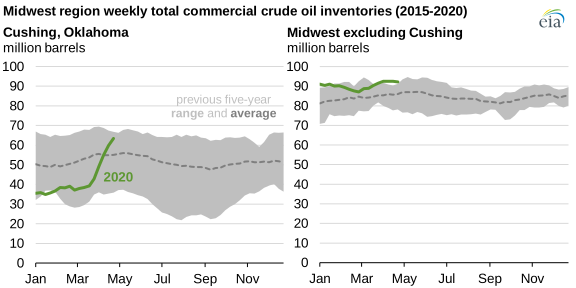
Inventories in the crude oil storage hub in Cushing, Oklahoma, increased by 24.9 million barrels (69%) from March 13 to April 24. The weekly inventory builds in Cushing for the weeks ending April 3, 10, and 17 are the three largest weekly inventory builds on record. Because market participants that hold West Texas Intermediate (WTI) futures contracts to expiration must take physical delivery of WTI crude oil in Cushing, the availability of crude oil storage there is important to facilitate the physical transfer. On April 20, 2020, the scarcity of available crude oil storage at Cushing meant several market participants sold their futures contracts at negative prices, in effect paying counterparties to close out of their contracts for them. Another important factor is that a portion of unused space at terminals is required for normal functioning of petroleum storage and transportation systems, and the unused space could be held for incoming crude oil or other operational considerations.
To help stakeholders better assess crude oil storage and capacity, EIA began providing weekly estimates of U.S. crude oil storage capacity utilization in the Weekly Petroleum Status Report (WPSR). EIA surveys inventory levels weekly, but because capacities rarely change, crude oil storage capacities are surveyed less often. EIA’s most recent Working and Net Available Shell Storage Capacity Report was released in November 2019 with data through September 2019; the next release will be on May 29, 2020, with data through March 2020.
In EIA’s Weekly Petroleum Status Report published yesterday, U.S. crude oil storage has reached 61% of working capacity, up from 60% the previous week. In the Gulf Coast and Midwest, storage capacity utilization rose to 60% and 65%, respectively. Within the Midwest region, storage utilization at Cushing, Oklahoma, rose to 81%.
Principal contributors: Matthew French, Corrina Ricker