
North Dakota flared 19% of its natural gas production in 2019
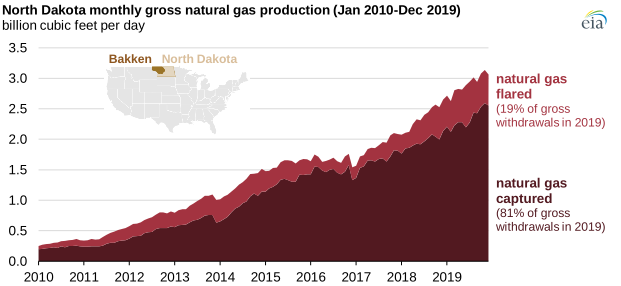
According to the North Dakota Oil & Gas Division’s February 2020 Director’s Cut & Monthly Production Report, gross natural gas production in North Dakota averaged 2.9 billion cubic feet per day (Bcf/d) in 2019, an 827% increase compared with the 2010 level of 0.3 Bcf/d. Increases in natural gas production came primarily from associated gas recovered from oil wells in the Bakken and Three Forks formations. In 2019, North Dakota flared 19% of its gross natural gas production, or 0.56 Bcf/d.
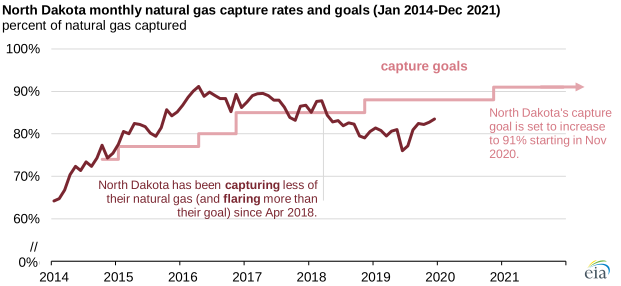
Natural gas that is not captured is often flared. Flaring occurs when natural gas is burned at the wellhead of the production site. North Dakota implemented natural gas capture goals in 2014 to limit the amount of flaring into the atmosphere. The state natural gas capture target was initially set at 75% and set to increase over time. The current gas capture rate of 88%, which went into effect in November 2018, is set to increase again in November 2020 to 91%.
Insufficient natural gas processing capacity and lack of pipeline infrastructure in North Dakota have resulted in lower compliance with the state’s natural gas capture goals since 2018. The state natural gas capture target has not been met in any month since March 2018. Compliance decreased in 2019, when 81% of natural gas produced in North Dakota was captured, which was down from 83% the previous year. Limiting natural gas production in North Dakota also constrains oil production because most natural gas comes from oil wells.
Natural gas processing plants are midstream facilities that remove contaminants and separate natural gas plant liquids from natural gas. In 2019, capacity additions for natural gas processing plants increased total capacity by 0.7 Bcf/d to reach 3.1 Bcf/d. An additional 0.9 Bcf/d of natural gas processing capacity is expected to enter service during 2020 and 2021, according to the North Dakota Pipeline Authority. These additions will allow more recovered natural gas to be processed, which will support crude oil production growth, but the new capacity may fill up faster than anticipated.

The North Dakota Industrial Commission (NDIC) issued an order in November 2019 to encourage firm service contractual agreements along natural gas gathering pipelines, which connect production sites to pipeline systems. Firm service contracts may provide a greater level of certainty to producers because service along the gathering line is guaranteed and may reduce the amount of well shut-ins and flaring. NDIC acknowledged concerns that firm service may crowd out smaller producers and create inequities among current and future contracts.
A low natural gas price environment makes building gathering lines and natural gas processing facilities harder. However, according to NDIC, firm service contracts may encourage a faster investment in gathering line infrastructure because economic risk is shared between natural gas producers and midstream companies.
Principal contributors: Steve Hanson, Emily Geary
Tags: production/supply, natural gas, states, North Dakota