
As total U.S. crude oil imports have fallen, imports from Canada have increased
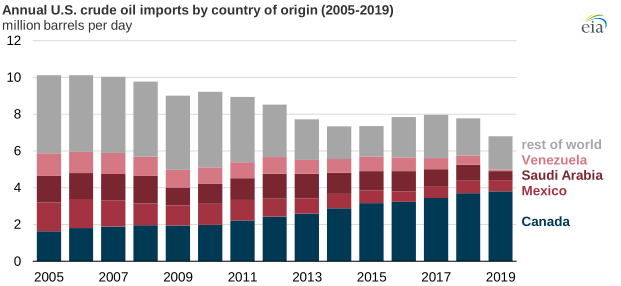
In 2005, U.S. refineries relied heavily on foreign crude oil, importing a record volume of more than 10.1 million barrels per day (b/d). About 60% of the imported crude oil came from four countries: Canada, Mexico, Saudi Arabia, and Venezuela, and each was responsible for between 12% and 16% of total U.S. crude oil imports that year. By 2019, U.S. crude oil import trading patterns had changed significantly. In total, U.S. crude oil imports have fallen sharply, but imports from Canada have risen steadily to 3.8 million b/d, more than twice the imports from Canada in 2005. U.S. crude oil imports from Canada accounted for 56% of all U.S. crude oil imports in 2019, according to the U.S. Energy Information Administration’s (EIA) Petroleum Supply Monthly.
U.S. imports of crude oil remained relatively high through 2007 until the economic downturn in 2008–09 led to lower demand for petroleum products. However, since 2010, crude oil imports did not grow along with the U.S. economy because of increasing domestic crude oil production. As a result, by 2019, total U.S. crude oil imports were down to 6.8 million b/d, or about one-third less than 2005 volumes.
Domestic refineries’ use of crude oil from Canada has increased in nearly every year since 2009, but imports from Saudi Arabia, Mexico, and Venezuela have generally decreased. These changes in crude oil trade were driven by the relative price and refinery operational advantages for importing oil from Canada, which displaced more and more barrels from Saudi Arabia. Persistent decline in production in both Mexico and Venezuela, along with U.S. restrictions on crude oil imports from Venezuela in 2019, contributed to fewer imports from those countries.
Direct comparisons of the top three importing countries, based on EIA’s monthly data from 2019, further show that the crude oil imports from Canada of 3.8 million b/d were more than seven times greater than those from Saudi Arabia (500,000 b/d) and more than six times greater than crude oil imports from Mexico (599,000 b/d).
Principal contributor: John Duff
Tags: exports/imports, liquid fuels, Canada, crude oil, oil/petroleum