U.S. Energy Information Administration logo
Skip to sub-navigation
March 12, 2020

U.S. crude oil exports increased to nearly 3 million barrels per day in 2019
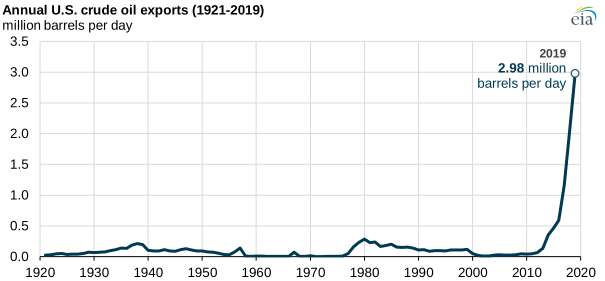
annual U.S. crude oil exports
Source: U.S. Energy Information Administration, Petroleum Supply Monthly

U.S. crude oil exports averaged 2.98 million barrels per day (b/d) in 2019, up 45% (930,000 b/d) from 2018. This growth in U.S. crude oil exports was driven by increasing U.S. crude oil production, expanding domestic infrastructure, and increasing global demand for light, low-sulfur crude oils. The number of destinations for U.S. crude oil exports also increased from 41 to 44. Canada received the largest share of U.S. crude oil exports at 459,000 b/d (15%), followed by South Korea at 426,000 b/d (14%).
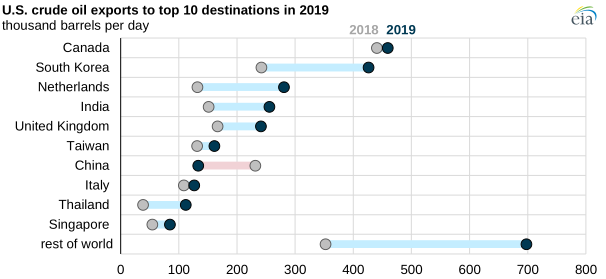
U.S. crude oil exports to top 10 destinations in 2019
Source: U.S. Energy Information Administration, Petroleum Supply Monthly

Conversely, U.S. crude oil exports to China, the third-largest export destination in 2018, fell by nearly 100,000 b/d to average 133,000 b/d in 2019, dropping China to the seventh-largest export destination in 2019.

In the first half of 2018, the United States exported 389,000 b/d of crude oil to China, which made China the top destination for U.S. crude oil exports during that period. However, in the summer of 2018, trade negotiations between the United States and China and unfavorable prices led China to reduce imports of U.S. crude oil to an average of just 77,000 b/d.

In 2019, the reduction of U.S. exports to China continued; U.S. crude oil exports to China averaged only 133,000 b/d in 2019 compared with 232,000 b/d in full-year 2018. Although U.S. exports to China declined in 2019, U.S. crude oil exports to other destinations increased, most notably to South Korea, the Netherlands, and India.

Principal contributor: Mason Hamilton

Statistics
Analysis
Tools
Education
News

Petroleum & Other Liquids

Crude oil, gasoline, heating oil, diesel, propane, and other liquids including biofuels and natural gas liquids.

Natural Gas

Exploration and reserves, storage, imports and exports, production, prices, sales.

Electricity

Sales, revenue and prices, power plants, fuel use, stocks, generation, trade, demand & emissions.

Coal

Reserves, production, prices, employment and productivity, distribution, stocks, imports and exports.

Nuclear & Uranium

Uranium fuel, nuclear reactors, generation, spent fuel.

Renewable & Alternative Fuels

Includes hydropower, solar, wind, geothermal, biomass and ethanol.

EIA Survey Forms

Forms EIA uses to collect energy data including descriptions, links to survey instructions, and additional information.

Total Energy

Comprehensive data summaries, comparisons, analysis, and projections integrated across all energy sources.

U.S. States

State energy information, including overviews, rankings, data, and analyses.

International

International energy information, including overviews, rankings, data, and analyses.

Environment

Greenhouse gas data, voluntary reporting, electric power plant emissions.

Data Tools, Apps, & Maps

Tools to customize searches, view specific data sets, study detailed documentation, and access time-series data.

Open Data

EIA's free and open data available as API, Excel add-in, bulk files, and widgets

EIA Beta

Come test out some of the products still in development and let us know what you think!

Open Source Code

EIA's open source code, available on GitHub.

RSS Feeds

Subscribe to feeds for updates on EIA products including Today in Energy and What's New.