Electricity tends to flow south in North America
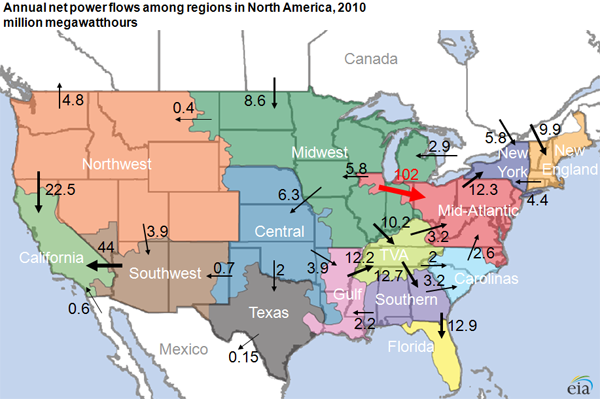
The map above shows that electricity tends to flow south in North America. The numbers on the map reflect average net power flows—metered hourly—between electric systems aggregated by regions for the year 2010. Most electric power demand is served by local generators. Net interregional trade accounted for less than 1% of delivered power in 2010. However, excess, low-cost power—primarily from hydroelectric generators in the Pacific Northwest, Manitoba, and Quebec—supplied higher-cost markets to the south.
In the map above, the numbers next to the arrows represent annual net flows of electricity between regions measured in millions of megawatt-hours. FERC's Form 714 collects from all U.S. balancing authorities (electric systems) the annual sum of actual hourly interchange (flows) received from and delivered to other directly-connected balancing authorities. The numbers shown in the figure represent the net balance of flows between pairs of regions created from balancing authority level data.
Electricity tends to flow south in North America. Electricity flows south from the Northwest to California and the Southwest. It flows south from Manitoba to the Midwest and from there to the Central region (the Southwest Power Pool) and the Tennessee Valley Authority (TVA). Electricity also flows south from TVA to the Southern region (Southern Company) and from the Southern region into Florida. It flows south from eastern Canada into New England, New York, and the Midwest.
There is also a circular flow pattern from the Midwest region through the Central, Gulf, TVA, Southern and Carolinas regions into the Mid-Atlantic region (PJM Interconnection) and on to New York (New York ISO). Surprisingly, the data show that, on net, power flows from the Mid-Atlantic region to the Midwest. The flow of low-cost, coal-fired power from the Midwest to the east during on-peak hours may be offset by the flow of nuclear generation from Exelon's Commonwealth Edison service area in and around Chicago (part of the Mid-Atlantic region) to the surrounding Midwest region during off-peak hours.
California is the largest net importer of electricity, consuming power produced in the Northwest and Southwest. These two regions provide about 25% of California's electricity supply.
While the map shows annual data, some flows are distinctly seasonal. For instance, the hydro capacity in the Pacific Northwest generates large amounts of electricity in excess of the region's need (and, therefore, large transfers to other regions) when river flows are typically highest in spring and early summer.
The map does not show sometimes significant intraregional flows, with one exception. The far western part (in northern Illinois) of the Mid-Atlantic region (PJM Interconnection) is separated from the rest of PJM. Substantial, low-cost electricity generated with nuclear and coal-fired capacity from the Commonwealth Edison service area flows over transmission lines through the Midwest region (Midwest ISO) and back into the eastern portion of PJM (see red arrow). This intraregional flow amounted to about 100 million MWhs in 2010, or 14% of delivered power in PJM.