
Wholesale electricity prices were generally lower in 2019, except in Texas
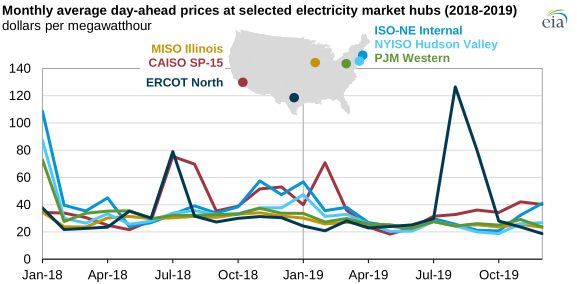
Wholesale electricity prices at several major hubs were generally lower in 2019 than in 2018, except in Texas. Record-high electricity demand in the summer led to much higher 2019 wholesale electricity prices in the Electric Reliability Council of Texas (ERCOT) electricity market.
Day-ahead, around-the-clock wholesale electricity prices averaged $38 per megawatthour (MWh) in ERCOT in 2019, up 13% from their 2018 average. At other representative hubs—such as those in the Independent System Operator of New England (ISO-NE), New York Independent System Operator (NYISO), and PJM Interconnection—annual average wholesale electricity prices were generally 15% to 30% lower than in 2018. Much of this decline in wholesale electricity prices was the result of lower natural gas prices in 2019.
On an annual average basis, wholesale electricity prices in these markets were lower than in 2018, and monthly average prices remained lower than $75/MWh, except in ERCOT. In the northwestern United States, constraints on a transnational natural gas pipeline system resulted in higher wholesale electricity prices in the region in February. This increase also had implications for electricity markets in California, where prices also increased in February. In New England, timely deliveries of liquefied natural gas helped reduce price volatility for both natural gas and electric power markets in the first quarter of the year.
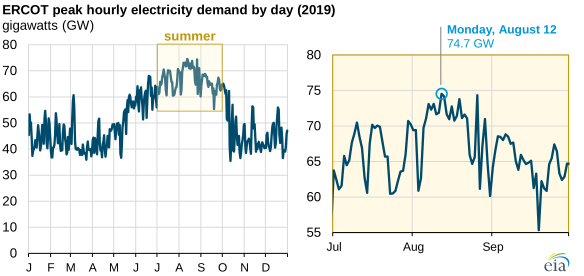
By comparison, Texas wholesale electricity prices increased in 2019. Monthly average wholesale prices in ERCOT were highest in August, when ERCOT saw record-high electricity demand. ERCOT—the grid operator for 90% of the electricity sold in Texas—has one of the lowest reserve margins of any electricity market region in the United States, meaning that it has a relatively small buffer of extra capacity beyond the amount needed to serve the expected peak electricity demand in the region.
During times of high demand, electricity prices in ERCOT increase, reflecting the use of more expensive electricity resources as well as the decreasing amount of remaining extra generating capacity. These price movements serve as a market signal for generators to produce more electricity and for consumers to use less electricity.
As anticipated in its assessment of resource adequacy report issued in early May, ERCOT expected to set a new record for electricity demand in summer 2019 and anticipated using several tools to maintain sufficient operating reserves. On the afternoon of Monday, August 12, 2019, ERCOT hit a record high of 74,666 megawatts of electricity demand. Later that week, ERCOT issued Level 1 Energy Emergency Alerts on two occasions that allowed ERCOT to use special resources only available during situations of grid stress, such as when operating reserves dip below certain threshold levels. These special resources include emergency demand response, industrial load reductions, additional supply from neighboring regions, and voluntary calls for customer conservation. On those days (August 13 and 15), real-time wholesale prices reached their $9,000/MWh cap for several hours.
ERCOT is unique among balancing authorities in that it does not have a centralized capacity market. Many other wholesale electricity market regions served by regional transmission organizations or independent system operators use capacity markets as a separate market mechanism to encourage investment in generation resources and ensure adequate reserves. In these markets, wholesale energy market prices are often lower because of the capacity payments that are providing an additional source of revenue for generators.
Principal contributor: Owen Comstock
Tags: generation, electricity, wholesale prices