
The nonmetallic minerals industry is one of the world’s top energy users
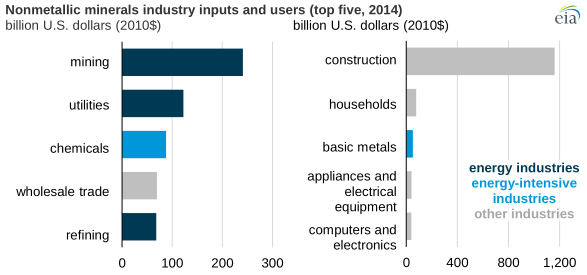
Note: Dollar values are expressed in 2010 U.S. dollars, converted based on purchasing power parity.
The industrial sector is the largest energy end-use sector by consumption in the world, accounting for about 55% of world delivered energy in 2018, according to the International Energy Agency. In the industrial sector, the nonmetallic minerals industry is one of the largest energy users, accounting for 10% of global industrial sector energy use. The nonmetallic minerals industry uses a large amount of process heat (primarily in ovens and kilns), which links the industry to the global energy system.
Nonmetallic mineral products take basic natural materials, such as lime, and turn them into essential building materials, such as cement, which is used to make concrete and mortar. Many of these products are heavy and fragile—such as glass—and do not lend themselves to long-distance transport. For low value products often sold in bulk, such as cement, production is also heavily localized.
Nonmetallic minerals use primarily coal, natural gas, and petroleum coke as energy sources for heat and as electricity for conveyors. The nonmetallic minerals industry is one of the top users of petroleum coke. The construction industry is the largest user of nonmetallic mineral products, accounting for nearly 1.2 trillion dollars’ worth of material in 2014.
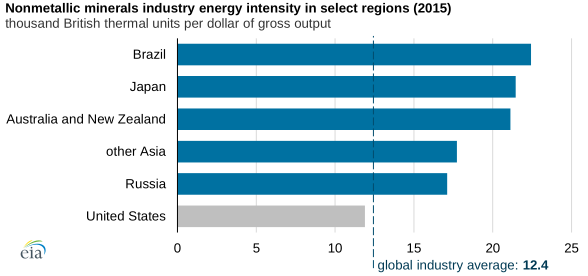
Note: Dollar values are expressed in 2010 U.S. dollars, converted based on purchasing power parity. Other Asia excludes Japan, China, India, and South Korea.
The energy intensity of the nonmetallic minerals industry—energy consumed per unit of gross output—is higher than many other industries. Brazil was the most energy-intensive producer of nonmetallic minerals in 2015 with an average energy intensity of about 22,000 British thermal units (Btu) per dollar, followed by Japan with an average intensity of 21,000 Btu/dollar.
Neither the Brazilian nor the Japanese nonmetallic minerals industries are among the largest producers nor are they projected to grow particularly fast, which means their impact on this industry’s energy use is limited. By comparison, the energy intensity of the U.S. nonmetallic minerals industry in 2015 was much lower, at nearly 12,000 Btu/dollar, and produced three times more nonmetallic minerals by purchasing power parity (PPP) adjusted dollars of gross output than Brazil and nearly twice as much as Japan.
U.S. nonmetallic minerals ship all over the world and most exports go to Canada, Mexico, and Germany. According to the World Input-Output Database, a trade database that standardizes national accounts across the globe, U.S. exports of nonmetallic minerals in 2014 totaled $11 billion—about 0.6% of total U.S. exports—which is a relatively small amount because many nonmetallic mineral products are not easily tradable.
Principal contributor: Elizabeth Sendich
Tags: consumption/demand, industrial