Electric generation transforms primary energy into secondary energy
Note: Click for full U.S. electricity flow 2018 diagram. Conversion losses include 3.9 quadrillion British thermal units (Btu) that result from generation from noncombustible renewable energy sources (hydroelectric, geothermal, solar, and wind energy) for fossil fuel equivalence.
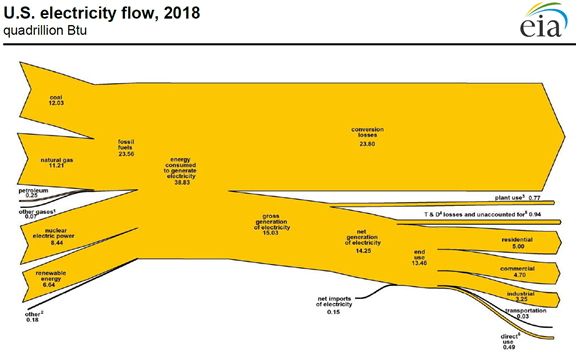
In 2018, U.S. utility-scale electricity generation facilities consumed nearly 39 quadrillion British thermal units (quads) of energy to provide 13 quads of electricity for end-use consumption. Of the 101 quads of total primary energy consumed in 2018, U.S. electricity generation accounted for more than 38% of total end-use consumption. The U.S. Energy Information Administration’s (EIA) U.S. electricity flow diagram visualizes U.S. electricity flow from energy sources consumed to generate electricity and electricity net imports to disposition (conversion and other losses, plant use, and end-use consumption).
Electricity is a secondary energy source that is produced when energy sources such as coal, natural gas, nuclear, and renewable energy are converted into electric power. Conversion losses, which refer to the energy lost while generating electricity, totaled 23.8 quads in 2018, or 61% of total consumption.

Note: Other energy sources include petroleum, other gases, batteries, chemicals, pitch, purchased steam, sulfur, miscellaneous technologies, and non-renewable waste.
The technology and the fuel type used to generate electricity affect the efficiency of power plants. For example, in 2018, coal represented 31% of energy consumption (12.0 quads), and it produced 27% of the electricity generated in the United States (3.9 quads). By contrast, natural gas represented 29% of energy consumption (11.2 quads), but it produced 35% of U.S. electricity generation (5.0 quads). The difference reflects the fact that the plants installed in the United States generate electricity from coal less efficiently than those that generate electricity from natural gas. In operating U.S. power plants, generating a kilowatthour of electricity from coal requires about one-third more British thermal units of energy than producing a kilowatthour from natural gas.

Note: Electricity is assumed to have a constant heat content of 3,412 British thermal units per kilowatthour.
In recent decades, the U.S. electric power grid’s fuel mix has shifted from mostly coal to a more diverse selection of fuels including natural gas, nuclear power, and renewable energy. In particular, the shift toward newer, more efficient natural gas-fired power plants with combined-cycle generators has resulted in an increase in the average efficiency of fossil fuel-fired electric power plants and in lower levels of overall conversion losses.

Note: Direct use of electricity is self-generated. It is either produced by the same entity that consumes the power or an affiliate, and it is used in direct support of a service or industrial process located within the same facility or group of facilities that house the generating equipment. Direct use is exclusive of station use.
In terms of end use, nearly all (96%) of the 13.5 quads of electricity used in the United States during 2018 was delivered as retail sales to the four end-use sectors (residential, commercial, industrial, and transportation). The remaining 4% was self-generated electricity for direct use by facilities in the commercial and industrial sectors. The residential and commercial sectors consumed nearly 75% of electricity retail sales. The industrial sector also consumed a large amount of electricity (25% of retail sales). The transportation sector consumed the smallest amount of electricity in 2018 (0.03 quads).
EIA offers electricity data through various sources, including
- Electricity data browser, an interactive data browser containing nearly all of EIA’s electricity-related data series
- Monthly and annual electricity reports, which compile information from EIA’s electricity industry surveys
- Monthly Energy Review, EIA’s comprehensive source for historical energy data
Principal contributor: Bill Sanchez