
Lower anticipated global economic growth reduces expectations for 2019 global oil demand
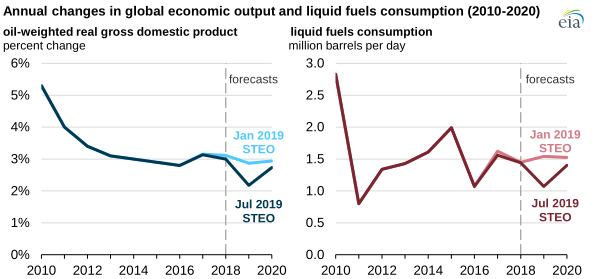
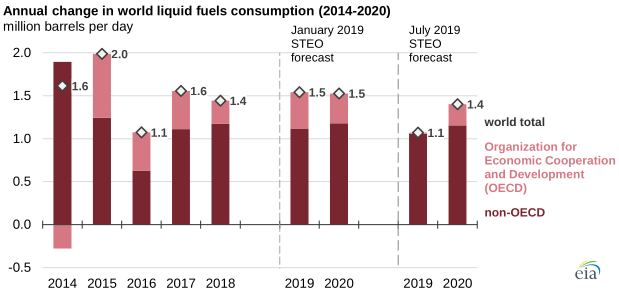
In its July 2019 edition of the Short-Term Energy Outlook (STEO), EIA forecasts that global liquid fuels consumption, which averaged 99.9 million barrels/day (b/d) in 2018, will grow by 1.1 million b/d in 2019 and by 1.4 million b/d in 2020. EIA has revised down its expectation for global liquids demand growth for six consecutive months. This revision reflects slower expected economic growth in many of the world’s largest oil-consuming countries, lower than expected oil consumption so far this year, and higher crude oil prices.
One of the main drivers of EIA’s global oil consumption forecast is global gross domestic product (GDP) based on country-level forecasts from Oxford Economics. EIA calculates an oil-weighted GDP by using relative magnitudes of oil consumption in each country. EIA revised the 2019 oil-weighted GDP growth rate from 2.9% in its January STEO to 2.2% in its July STEO. If realized, this 2.2% growth rate would be the lowest annual growth rate since 2009 and one of the main reasons for slower growth in global liquids consumption.
The July STEO forecast for 2019 also includes historical 2019 liquid fuels consumption data for the first quarter of the year for countries that are members of the Organization for Economic Cooperation and Development (OECD). Non-OECD consumption estimates were also updated to reflect new GDP data. Consumption during this period was less than forecast in the January STEO.
EIA attributes lower than expected OECD oil consumption earlier this year to relatively warm weather in Europe in February and March, which reduced heating oil consumption; slowing GDP growth; and a slowdown in Europe’s manufacturing sector.
Weather was also a likely cause for U.S. liquid fuels consumption in the second quarter of 2019 to be less than EIA had forecast at the beginning of the year. Initial estimates for May and June support the possibility that flooding in the Midwest affected the planting season for some farms. Because of the flooding, farmers likely reduced their consumption of diesel fuel for farming equipment.
In addition, crude oil prices affect the price of refined fuel prices, and higher fuel prices, all other factors being equal, typically cause fuel consumption to decline. In the first half of 2019, Brent crude oil prices were $7/b higher than forecast in the January STEO. EIA expects Brent crude oil prices to average $66/b in 2019 and $67/b in 2020, or $6/b higher and $2/b higher, respectively, than the price forecasts in the January STEO.
EIA now forecasts total liquid fuels consumption among OECD members to remain near last year’s level, which reflects a decrease from previous expectations for most countries. The July STEO expects declining liquid fuels consumption in countries including Japan, Canada, and OECD Europe to be offset by consumption growth in the United States.
By comparison, EIA expects liquid fuels consumption in non-OECD countries to increase by 1.1 million b/d, a level of growth that is both lower than the previous two years and lower than expected in the January STEO. More than half of the 2019 non-OECD consumption growth is in China, where EIA expects the completion of new petrochemical plants will increase demand for hydrocarbon gas liquids.
Principal contributor: Stacy MacIntyre