
Mixed water supply conditions affect hydropower outlook in Pacific Northwest
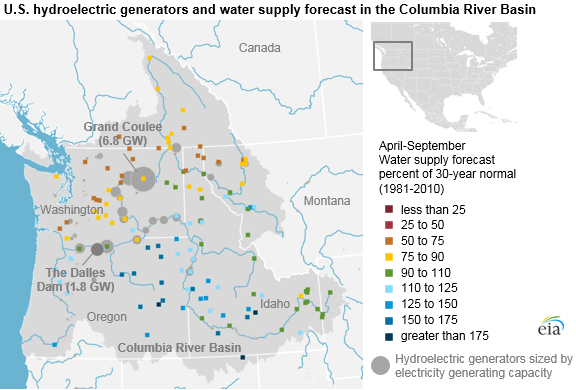
On June 6, the National Oceanic and Atmospheric Administration’s Northwest River Forecast Center (NWRFC) released its final Pacific Northwest water supply projection of 2019. The forecast through September, the end of the current water year, shows above-average water supply in the southern half of the Columbia River Basin and below-average supply in the northern half.
The Pacific Northwest is home to nearly one-third of the country’s hydroelectric capacity. Hydroelectric supply in the Pacific Northwest can have implications for the use of other electricity-generating fuels in the region and electricity trade with neighboring areas.
Snowpack, or accumulated winter snowfall, can indicate how much water will be available to power hydroelectric generators throughout the year as meltwater flows through the river basin. Regional snowpack patterns in the Pacific Northwest help to drive the NWRFC forecast. The southern half of the Columbia River Basin developed an above-normal snowpack earlier this year following above-normal snowfall in February 2019.
Conversely, snowpack in the northern half was near or below normal. These differences in regional snowpack are reflected in the regional differences in the water supply forecast for April through September.
The Dalles Dam is a run-of-river hydroelectric plant located near the mouth of the Columbia River. For this reason, hydro operators consider water flow at The Dalles as indicative of the entire upstream Columbia River system. As of June 13, the NWRFC projects The Dalles Dam water supply forecast for April through September to be 85.2 million acre-feet (MAF), approximately 8% lower than the 30-year normal (1981–2010).
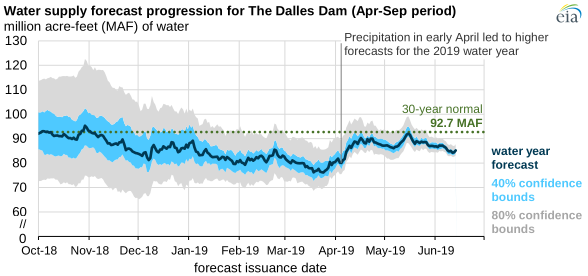
The Columbia River Basin experienced several weather events that brought heavy precipitation to the region in early April 2019 that drove up near-term water supply forecasts at that time. These events expedited the melting of winter's snowpack, leading water runoff to peak earlier in the year than normal.
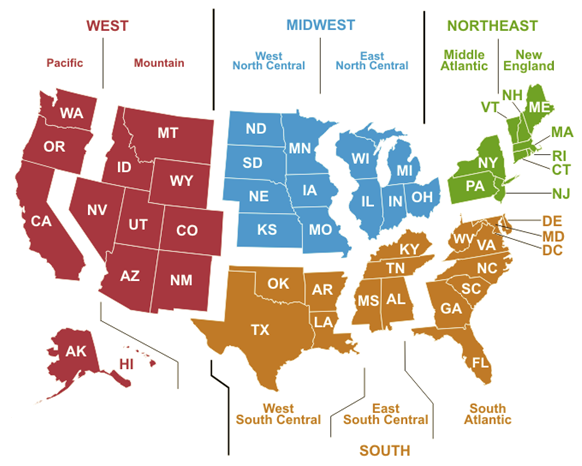
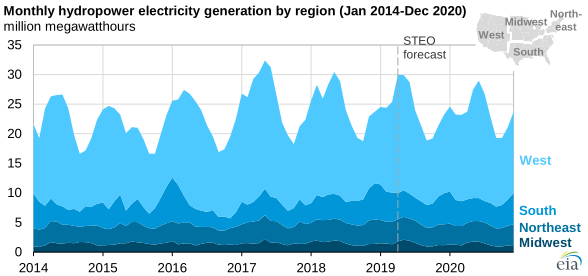
Because water supply and the subsequent hydroelectric generation can vary widely from year to year, these forecasts are closely monitored and used as inputs to EIA’s Short-Term Energy Outlook (STEO). The June 2019 STEO forecasts that hydroelectric generators will provide 285 million megawatthours in 2019. More than 60% of that total is from hydro plants in the West census region. Overall, hydroelectricity is expected to make up 7% of U.S. electricity generation in 2019.
Principal contributor: Michelle Bowman