The basic metals industry is one of the world’s largest industrial energy users
Note: Dollar values are expressed in 2010 U.S. dollars, converted based on purchasing power parity.
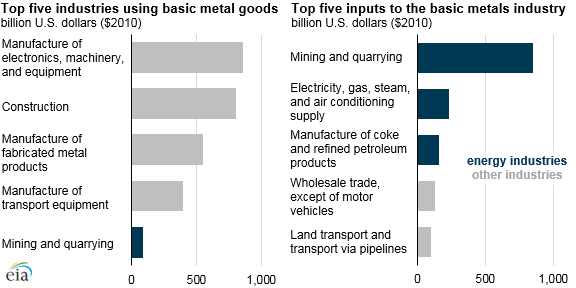
The industrial sector is the largest user of energy in the world, accounting for approximately 55% of world delivered energy in 2018, according to the International Energy Agency. Within the industrial sector, the basic metal industry is one of the largest energy users, accounting for 12% of global industrial sector energy use.
The basic metals industry includes the manufacture of iron, steel, aluminum, and other intermediate metal goods. Some of the main products of the basic metals industry include steel girders, aluminum sheets, and copper wire.
Large amounts of energy are needed to heat ovens for melting and manipulating raw ores and metal. In some parts of the basic metals industry, the selection of fuel is also driven by important chemical factors, such as the need for coking (or metallurgical) coal used in iron smelting. In addition, just as energy is an important input for the basic metals industry, metal goods are an important part of the energy system: equipment, pipelines, wires, and structural materials are used by the mining, refining, and electricity industries to produce and transport energy.
Note: Dollar values are expressed in 2010 U.S. dollars, converted based on purchasing power parity.
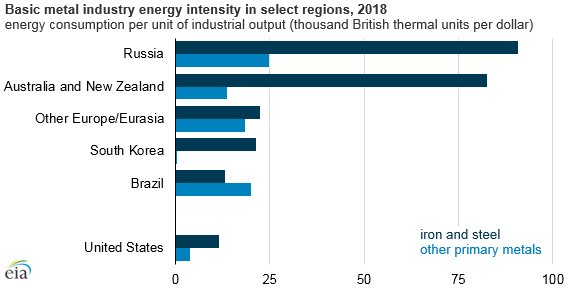
Because energy is a main input to the basic metals industry, the energy intensity of the industry, or energy consumed per unit of output, is relatively high compared with other industries. However, the energy intensity of the basic metals industries varies widely by region. According to EIA’s International Energy Outlook 2018, Russia was the most energy-intensive producer of all basic metal goods in 2015, with an average energy intensity of 68,000 British thermal units (Btu) per dollar, followed by Australia and New Zealand with an average intensity of 17,000 Btu/dollar.
In 2015, the Russian basic metals industry was dominated by iron and steel manufacturing; basic metals production in Australia and New Zealand was dominated by aluminum manufacturing. Manufacturing iron, steel, and aluminum involves processing raw ores, which is the most energy intensive process in the basic metals industry. The reason these countries process such high levels of the ores necessary for iron, steel, and aluminum is partly because these natural resources are produced in their countries. In comparison, the energy intensity of the U.S. basic metal industry is much lower, at 8,000 Btu/dollar, because the industry is more diverse in the metals and stages along the processing path, such as recycling or producing intermediate parts.
U.S. basic metals ship all over the world, with a little more than half of U.S. basic metals exports going to Canada, Mexico, India, and China. According to the World Input-Output Database, U.S. exports of basic metals in 2014 was $31 billion—approximately 2% of total exports—but lower than the 2011 peak of $37 billion.
Principal contributor: Elizabeth Sendich
Tags: industrial