Winter (November-March) natural gas futures prices at lowest levels since 2001-2002
Note: October 20 was selected because it represents a date near the start of the natural gas winter heating season yet still has information for five months of the upcoming winter's natural gas NYMEX future's strip. These prices do not reflect expectations for the cost of transporting natural gas from Henry Hub to downstream market locations. The Henry Hub, in Erath, Louisiana, is the physical delivery location for the NYMEX natural gas futures contract. Sabine Pipeline is the operator of the Henry Hub.
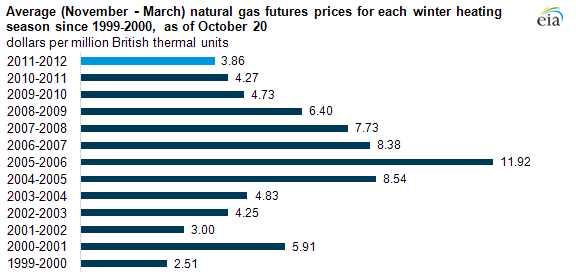
The average natural gas futures price for the upcoming winter is less than $4 per million British thermal units (MMBtu), the lowest level entering the winter since 2001-2002. The so-called "winter strip," the average natural gas futures price for the contract months November through March as settled on the New York Mercantile Exchange (NYMEX), is a closely followed measure of market participants' price expectations. In markets such as New England and California, where natural gas prices often set on-peak, wholesale power prices, the NYMEX winter strip for natural gas also can influence expectations for forward wholesale power prices.
Late October expectations for average winter natural gas prices have not been this low since the winter of 2001-2002. Winter price expectations, as reflected through the winter strip on NYMEX, peaked at almost $12 per MMBtu in 2005 in the aftermath of supply disruptions related to Hurricanes Katrina and Rita. Starting in 2009, late fall expectations for average winter natural gas futures prices dipped under $5 per MMBtu as domestic natural gas production from shale plays grew rapidly.
Tags: financial markets, futures, natural gas, prices