Pipeline constraints, refinery maintenance push Western Canadian crude oil prices lower
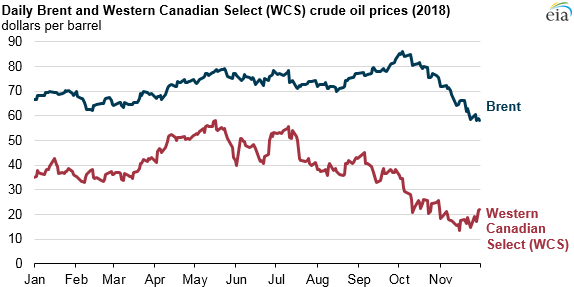
Planned maintenance at several large refineries in the Midwest has decreased the volume of crude oil processed in the region, which has resulted in lower prices of Western Canadian Select (WCS), a crude oil typically processed in the Midwest. WCS crude oil is typically priced lower than other crude oils because of differences in crude oil quality, but increasing production of WCS and pipeline capacity constraints in Western Canada have resulted in even lower prices of WCS compared with crude oil benchmarks such as Brent.
Even without transportation constraints, WCS is often priced lower than Brent because of its classification as a relatively heavy, sour grade of crude oil. Heavier, sour grades of crude oil require additional processing to yield higher-value refined products such as gasoline. WCS’s density requires blending it with a lighter oil so that it can flow smoothly in pipelines, which adds expense.
In mid-October, the price difference between WCS and Brent reached its widest spread since 2012, with WCS priced nearly $60 per barrel (b) less than Brent. The spread most recently settled at $36.25/b on November 30, with the WCS spot price falling to $21.93/b on that day.
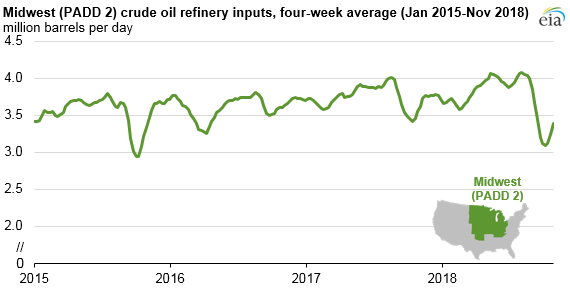
After several months of record and near-record refinery runs in the Midwest (defined as Petroleum Administration for Defense District 2), the four-week rolling average of crude oil inputs for the week ending October 26 fell to 3.1 million b/d as a result of scheduled maintenance. This level is the lowest four-week average since 2015, according to EIA’s Weekly Petroleum Status Report.
Relatively low Midwest refinery inputs of crude oil have temporarily reduced the main market for WCS crude oil. Four-week average refinery utilization for the week ending October 26 was 73%, the lowest utilization in the region at any point since 1985.
Pipeline constraints in Western Canada have resulted in more crude oil delivered by rail, a more expensive option than pipelines, further affecting the crude oil discounts at a time of low refinery demand. With limited options to reach other export markets, Canada has exported more than 80% of its annual crude oil production to the United States every year since 2014.
Refineries in the Midwest process most of the Canadian crude oil imported to the United States. In 2017, Midwest refineries processed 2.4 million b/d of Canadian crude oil, which accounted for 68% of U.S. imports of Canadian crude oil and nearly 60% of Canada’s average daily crude oil production.
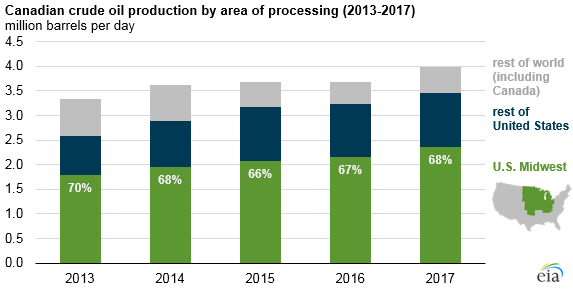
Rising crude oil production in Western Canada has outpaced the ability to export the crude oil and has further affected the price discount. Crude oil production in Canada increased to nearly 4.0 million b/d in 2017, up approximately 0.3 million b/d from 2016. According to Government of Canada estimates, oil sands development accounted for 64% of the country’s 2017 crude oil production. Oil sands projects typically have higher upfront capital costs than conventional oil projects but generally have lower operating costs and can continue producing during times of relatively low crude oil prices.
Principal contributor: Kelsey Hallahan
Tags: prices, Midwest, pipelines, liquid fuels, Canada, crude oil, oil/petroleum, refinery capacity