
Average U.S. electricity customer interruptions totaled nearly 8 hours in 2017
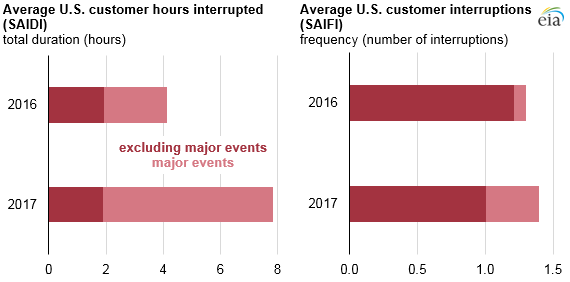
Electric power for U.S. customers was interrupted for an average of 7.8 hours (470 minutes) in 2017, nearly double the average total duration of interruptions experienced in 2016. More major events such as hurricanes and winter storms occurred in 2017, and the total duration of interruptions caused by major events was longer. Excluding major events, the average duration of interruptions customers experienced was almost identical in 2016 and 2017, at about 2 hours in both years. In 2017, the average customer experienced 1.4 interruptions counting major events and 1.0 interruption excluding major events.
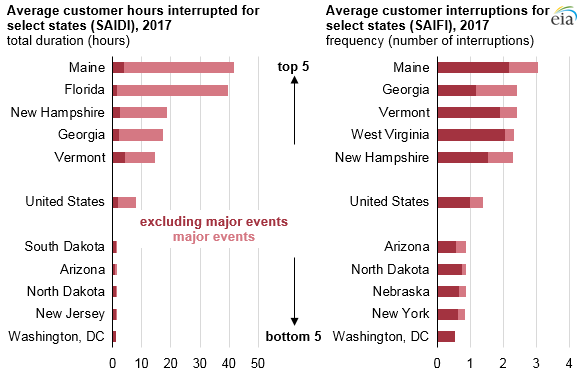
The District of Columbia, New Jersey, North Dakota, Arizona, and South Dakota had the shortest total time interrupted in 2017, with average interruptions ranging from 58 minutes (District of Columbia) to 95 minutes (South Dakota).
Maine, Florida, New Hampshire, Georgia, and Vermont on average had the longest total time interrupted in 2017. In each of these states, the large interruption durations were caused by major events such as winter storms (in the case of Maine, New Hampshire, and Vermont) or hurricanes (in the case of Florida and Georgia). The average customer interruption time in these five states ranged from 15 hours in Vermont to 42 hours in Maine.
Puerto Rico experienced the longest U.S. blackout in history as a result of Hurricane Maria; however, the data in this analysis does not include Puerto Rico.
The metrics that describe the duration and frequency of interruptions are known as the System Average Interruption Duration Index (SAIDI) and System Average Interruption Frequency Index (SAIFI). Many of the standards for reporting SAIDI and SAIFI were initially developed by the Institute of Electrical and Electronics Engineers (IEEE), a professional trade association for electric and information technologies and related fields.
Most utilities that report reliability metrics report all sustained interruption events; some utilities can also provide data that exclude events categorized as major events. For utilities following the IEEE standard, SAIDI and SAIFI are calculated based on any interruption lasting longer than five minutes, and the threshold for a major event is determined using a standard formula that incorporates a utility’s past five years of duration data. For utilities that do not follow the IEEE standard, the duration of events used to calculate SAIDI and SAIFI and the threshold for classifying an event as a major event may vary.
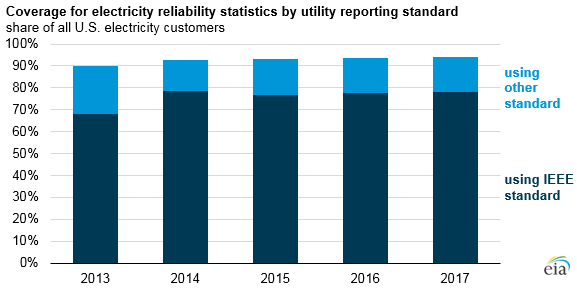
In 2017, electric utilities reported annual reliability metrics that accounted for 94% of U.S. electric customers, up from 90% of customers in 2013 when EIA first started collecting this data. Reporting coverage ranges from 72% of customers in North Dakota and South Dakota to 99% of customers in California, Connecticut, the District of Columbia, Florida, Hawaii, Maryland, Rhode Island, and West Virginia. Of the reported data, 78% of customers were covered by a utility that reported data using standards developed by IEEE.
Last year, EIA produced a video guide on SAIDI and SAIFI data reporting.
Principal contributors: Anodyne Lindstrom, Sara Hoff
Tags: electricity, outages, utility