The Wolfcamp play has been key to Permian Basin oil and natural gas production growth
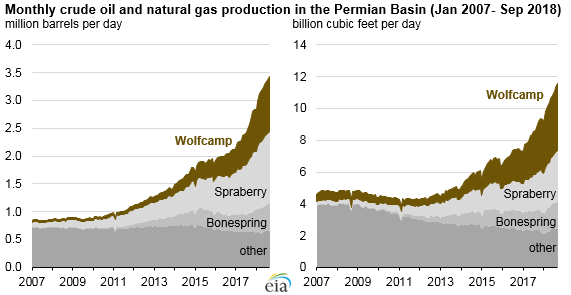
Increased oil and natural gas development in the Wolfcamp play has helped drive overall crude oil and natural gas production growth in the Permian Basin during the past decade. Drilling and completion operations within the Wolfcamp play have been responsible for much of the crude oil and natural gas production growth in the Permian Basin since 2007. As of September 2018, the Wolfcamp accounted for about 1 million barrels of crude oil per day (b/d) and 4 billion cubic feet of natural gas per day (Bcf/d). Crude oil production in the Wolfcamp accounts for nearly one-third of total Permian crude oil production and more than one-third of Permian natural gas production.
Rising productivity in the Wolfcamp, like in other plays in the Permian Basin, has been driven mostly by drilling longer horizontal laterals and optimizing completions. The length of the horizontal segments, or laterals, in the Wolfcamp increased from an average of 2,500 linear feet in 2005 to more than 8,500 linear feet in 2018. Well completion efficiency has also improved, primarily by more effectively using sand, or proppant, during the hydraulic fracturing process, as well as by using zipper fracturing—the completion of two or more wells side by side.
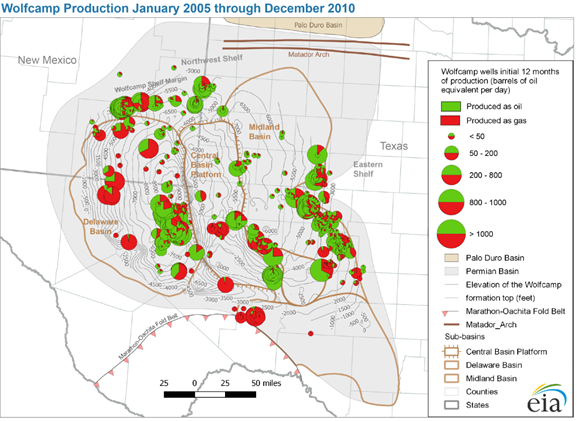
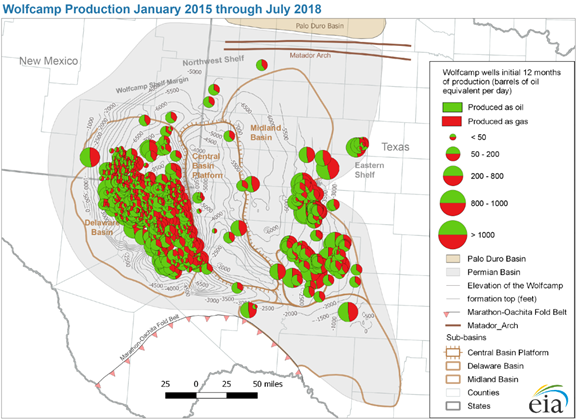
The number of producing wells in the Wolfcamp increased from 2,200 in 2005 to 7,750 in mid-2018. Average initial daily crude oil production per well for the first six months of operation grew from 37 b/d to 515 b/d, and average natural gas production per well for the first six months of operation grew from 0.1 million cubic feet per day (MMcf/d) to 2.0 MMcf/d during the same period. EIA expects Wolfcamp production to continue to drive production increases in the Permian region, although pipeline capacity constraints in the region are expected to slow the rate of growth through 2019.
Source: U.S. Energy Information Administration, based on DrillingInfo
Source: U.S. Energy Information Administration, based on DrillingInfo
Source: U.S. Energy Information Administration, based on DrillingInfo
The Wolfcamp formation extends across the Delaware Basin, Central Basin Platform, and Midland Basin—the three sub-basins that comprise the Permian Basin. The stacked formation has four intervals, called benches, which are designated from top to bottom as A, B, C, and D. Most of the current drilling activities take place in the Delaware and Midland Basins and target the Upper Wolfcamp (benches A and B), which is more oil-rich, rather than the Lower Wolfcamp (benches C and D), which is more natural gas-rich.
Of the stacked shale formations that comprise the Permian Basin, the Wolfcamp is the deepest and thickest but varies significantly across the formation. Wolfcamp subsea depth varies in the Delaware Basin from 0 feet in the west to 9,500 feet in the central areas. In the Midland Basin, the subsea depth ranges from 2,000 feet in the east along the Eastern Shelf to 7,000 feet along the basin axis, near the western basin edge. Wolfcamp thickness ranges from about 800 feet to more than 7,000 feet thick in the Delaware Basin, and thickness ranges from 400 feet to more than 1,600 feet thick in the Midland Basin, varying from 200 feet to 400 feet in the adjacent Central Basin Platform.
More information on crude oil and natural gas production is available in EIA’s Drilling Productivity Report and Monthly Crude Oil and Natural Gas Production Report.
Principal contributors: Olga Popova, Chris Peterson, Jason Upchurch, Kyra White
Tags: production/supply, natural gas, tight oil, Texas, wells, liquid fuels, oil/petroleum, states, drilling, New Mexico, Permian, PADD 3, map