U.S. Energy Information Administration logo
Skip to sub-navigation
November 14, 2018

U.S. crude oil and natural gas production increased in 2017, with fewer wells
U.S. natural gas wells and crude oil production
Source: U.S. Energy Information Administration, U.S. Oil and Natural Gas Wells by Production Rate
Note: Annual production estimates shown here are based on data from DrillingInfo and may differ from official estimates published in EIA’s Petroleum Supply Annual 2017 and Natural Gas Annual 2017.

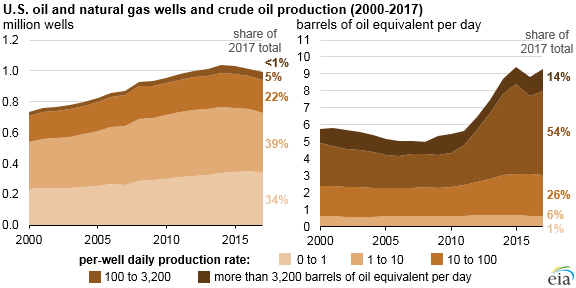
The total number of wells producing crude oil and natural gas in the United States fell to 991,000 in 2017, down from a peak of 1,039,000 wells in 2014. This recent decline in the number of wells reflects advances in technology and drilling techniques. EIA’s updated U.S. Oil and Natural Gas Wells by Production Rate report shows how daily production rates of individual wells contributed to U.S. total crude oil and natural gas production in 2017.

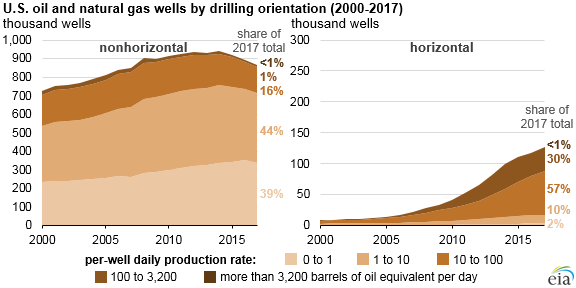
Wells classified as nonhorizontal in the report—most of which are vertical wells—have decreased from 940,000 in 2014 to 864,000 in 2017. Horizontal wells are relatively less common, but they are growing as a share of the total: the 99,000 horizontal wells drilled in 2014 accounted for 10% of the total. In 2017, 127,000 horizontal wells accounted for 13% of total wells drilled.

Although horizontal wells are more expensive to drill than vertical wells, they contact more reservoir rock and therefore produce greater volumes. Only 1% of vertical wells produced at least 100 barrels per day (b/d) of crude oil in 2017, but 30% of horizontal wells produced at least 100 b/d. As these relatively prolific horizontal wells became more common, production growth continued even as the well count fell.
U.S. oil and natural gas wells by drilling orientation
Source: U.S. Energy Information Administration, U.S. Oil and Natural Gas Wells by Production Rate
Note: Nonhorizontal wells include vertical and deviated wells and wells for which the type is unknown.

Even with fewer wells, U.S. oil production grew from 8.7 million b/d in 2014 to 9.3 million b/d in 2017. During that same period, U.S. natural gas gross withdrawals increased from about 78.7 billion cubic feet per day (Bcf/d) to 83.4 Bcf/d. Since 2017, crude oil and natural gas production has continued to grow, most recently measured at 11.3 million b/d and 85.2 Bcf/d in August 2018, respectively.

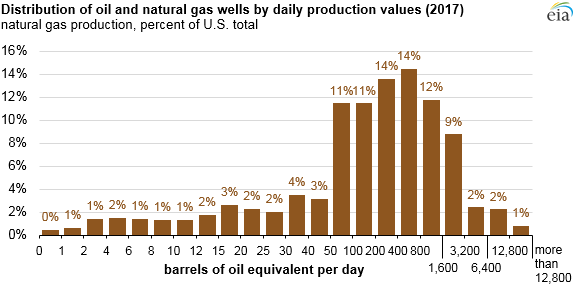
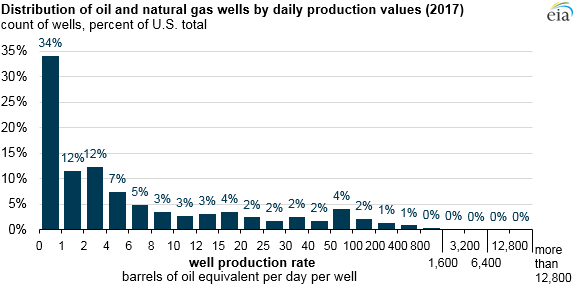
In EIA’s report, wells are grouped into 26 production volume brackets, ranging from less than one barrel of oil equivalent per day (BOE/d) to more than 12,800 BOE/d. Most of the U.S. oil and natural gas production comes from wells producing between 50 BOE/d and 1,600 BOE/d. In 2017, wells within this range accounted for 9% of the overall count of wells but 62% of crude oil production and 63% of natural gas production.
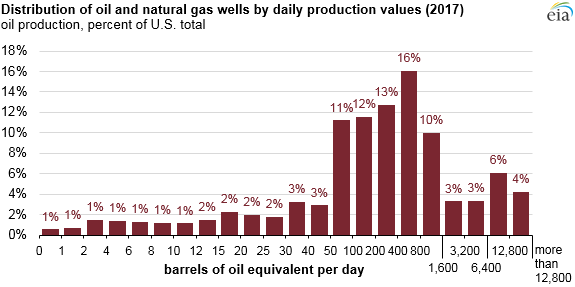
distribution of oil and natural gas wells by daily production values, as described in the article text

Source: U.S. Energy Information Administration, U.S. Oil and Natural Gas Wells by Production Rate

distribution of oil and natural gas wells by daily production values, as described in the article text

Source: U.S. Energy Information Administration, U.S. Oil and Natural Gas Wells by Production Rate

distribution of oil and natural gas wells by daily production values, as described in the article text

Source: U.S. Energy Information Administration, U.S. Oil and Natural Gas Wells by Production Rate

Principal contributors: Kristen Tsai, Jack Perrin, Meg Coleman

Statistics
Analysis
Tools
Education
News

Petroleum & Other Liquids

Crude oil, gasoline, heating oil, diesel, propane, and other liquids including biofuels and natural gas liquids.

Natural Gas

Exploration and reserves, storage, imports and exports, production, prices, sales.

Electricity

Sales, revenue and prices, power plants, fuel use, stocks, generation, trade, demand & emissions.

Coal

Reserves, production, prices, employment and productivity, distribution, stocks, imports and exports.

Nuclear & Uranium

Uranium fuel, nuclear reactors, generation, spent fuel.

Renewable & Alternative Fuels

Includes hydropower, solar, wind, geothermal, biomass and ethanol.

EIA Survey Forms

Forms EIA uses to collect energy data including descriptions, links to survey instructions, and additional information.

Total Energy

Comprehensive data summaries, comparisons, analysis, and projections integrated across all energy sources.

U.S. States

State energy information, including overviews, rankings, data, and analyses.

International

International energy information, including overviews, rankings, data, and analyses.

Environment

Greenhouse gas data, voluntary reporting, electric power plant emissions.

Data Tools, Apps, & Maps

Tools to customize searches, view specific data sets, study detailed documentation, and access time-series data.

Open Data

EIA's free and open data available as API, Excel add-in, bulk files, and widgets

EIA Beta

Come test out some of the products still in development and let us know what you think!

Open Source Code

EIA's open source code, available on GitHub.

RSS Feeds

Subscribe to feeds for updates on EIA products including Today in Energy and What's New.