Winter begins with higher U.S. heating oil and propane prices
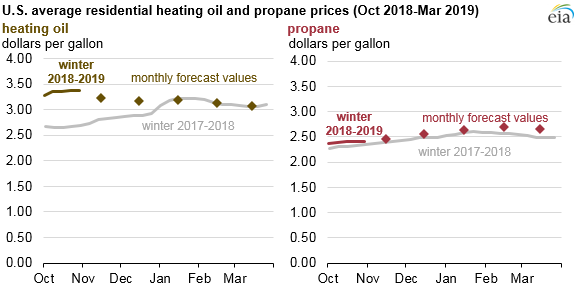
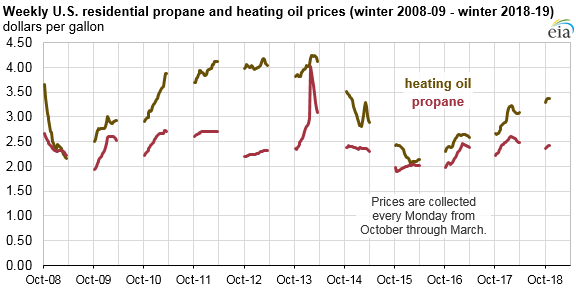
U.S. residential heating oil and propane prices at the start of the 2018–2019 winter heating season were 23% and 4% higher, respectively, than at the start of the last heating season. During the winter months (October–March), EIA conducts weekly surveys of residential heating oil and propane prices for many states through the State Heating Oil and Propane Program (SHOPP).
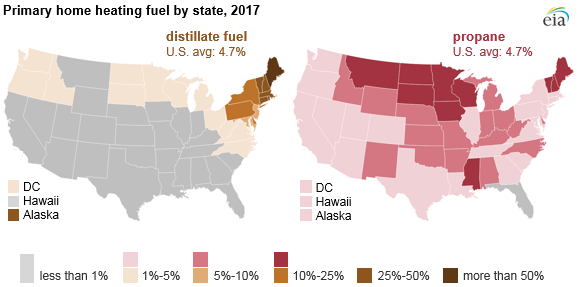
EIA’s October Short-Term Energy Outlook (STEO) forecasts that residential heating oil and propane prices will remain higher throughout the winter, contributing to higher expenditures. Energy bills are also influenced by weather. The National Oceanic and Atmospheric Administration (NOAA) anticipates that the 2018–2019 winter will be colder than last winter in much of the country. However, temperatures in the Midwest—the region with the most households that use propane for heating—are expected to be 1% warmer than last winter.
EIA’s STEO forecasts that, because of factors such as higher crude oil prices and lower fuel inventories, average heating oil and propane prices will be 14% higher and 4% higher than last winter, respectively. Prices for U.S. petroleum products such as heating oil and propane tend to follow changes in the Brent crude oil spot price, the most widely used global benchmark price for crude oil. The price of Brent crude oil on September 28, 2018, was $82 per barrel (b). EIA forecasts that Brent crude oil prices will average $74/b this winter, up from $64/b last winter.
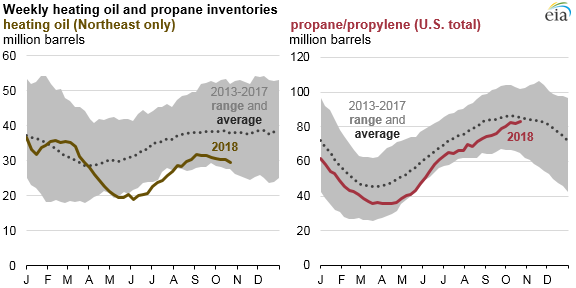
Although inventories of U.S. heating oil are lower this year than last year, they are still within the range of the previous five-year average. Distillate inventories fell to low levels earlier in 2018 because of continued growth in distillate demand, driven by strong global industrial and economic activity. Since then, distillate inventories have increased but still remain lower than the five-year average.
As of October 26, 2018, distillate fuel oil inventories in the Northeast (Petroleum Administration for Defense Districts 1A and 1B), where most heating oil is consumed, totaled 29.6 million barrels, 16% lower than at the same time last year and 7% lower than the five-year (2013–2017) average for that week.
Total U.S. propane/propylene inventory levels were 83.0 million barrels as of October 26, 2018, 3% lower than the previous five-year (2013–2017) average for that time of year. U.S. propane/propylene inventories have been lower than the previous five-year average for much of the past two years, mainly because of lower inventory levels on the Gulf Coast as a result of new infrastructure geared toward maximizing export volumes. Inventory levels in other regions have remained higher than the five-year average.
SHOPP is a joint effort between EIA and state energy offices that collects state-level residential heating oil and propane price data in many states where residential use of heating oil and propane is common. This survey started in 1978 and has expanded during the years in response to a growing need for timely price data during periods of supply disruption to heating oil and propane markets.
SHOPP data are used by state and federal governments, the media, policy makers, consumers, and analysts to monitor markets as well as to facilitate emergency response to supply shortages of these heating fuels during the winter months. SHOPP collects residential heating oil and propane data in 21 states. In 17 additional states, SHOPP collects propane prices but not heating oil prices, and in the District of Columbia, SHOPP collects heating oil but not propane prices. SHOPP also publishes wholesale heating oil prices for 26 states and propane prices for 23 states.
Weekly SHOPP price data are made available each Wednesday at 1:00 p.m. Eastern Time on the Winter Heating Fuels and Heating Oil and Propane Update webpages.
Principal contributor: Marcela Rourk
Tags: prices, weather, heating oil, propane