
The changing U.S. energy trade balance is still dominated by crude oil imports
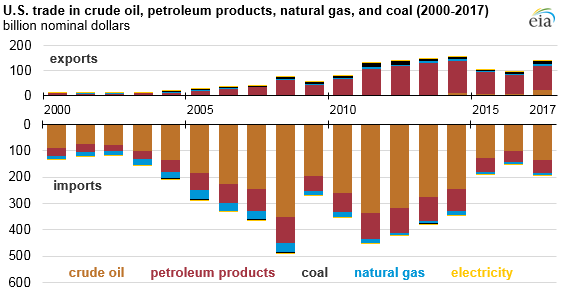
During the past decade, the U.S. trade gap for energy products has narrowed. From 2003 to 2007, the value of energy imports was about 10 times greater than the value of exports. By 2017, imports were only about 1.5 times greater than exports according to data from the U.S. Census Bureau.
The primary U.S. energy import is crude oil, which generally accounts for about two-thirds of the total value of energy imports. Petroleum products—including liquefied petroleum gas (LPG), gasoline, and diesel fuels—are the next largest category of imports, accounting for about 20% of the total value of energy imports.
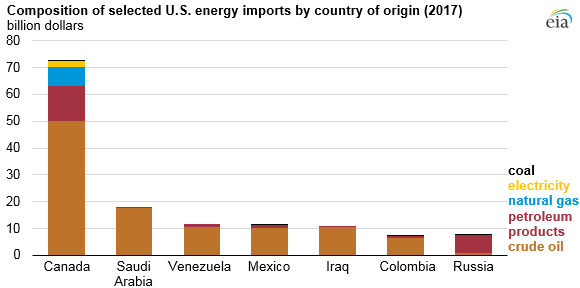
Canada is the largest U.S. trading partner for energy products. In 2017, energy imports from Canada were valued at $73 billion. Saudi Arabia provided the second highest volume of imports, followed by Venezuela, Mexico, Iraq, Columbia, and Russia. Together, these seven countries made up 72% of the value of U.S. energy imports in 2017.
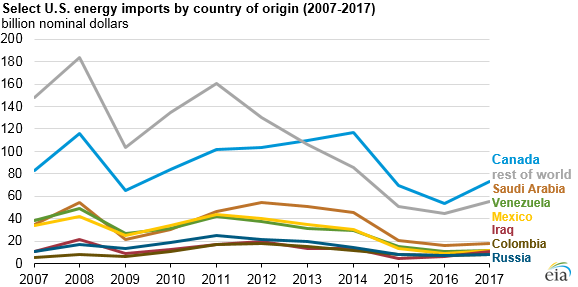
Crude oil accounts for most U.S. imports from each of the largest energy suppliers to the United States, except for Russia, which supplies mostly petroleum products. Almost all electricity imports come from neighboring Canada; electricity imports from Mexico are relatively small. Canada also supplies most of the U.S. natural gas imports.
The primary export for the United States is petroleum products. In 2017, petroleum products accounted for 70% of the total value of U.S. energy exports, although that share has decreased as exports of crude oil have increased following the removal of crude export restrictions in December 2015. Crude oil accounted for 16% of exports in 2017, while coal and natural gas accounted for 7% and 6%, respectively.
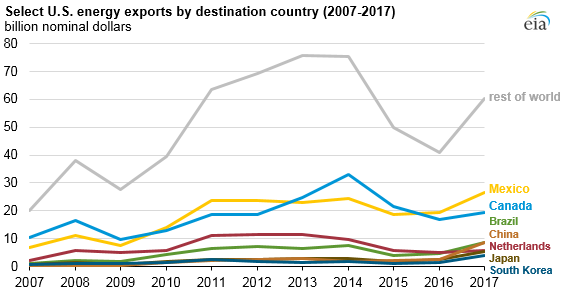
Except for Canada and Mexico, the top U.S. export destinations are different from the top import sources. Brazil was the third largest recipient of U.S. energy exports in 2017, followed by China, which has become an important destination for U.S. energy exports in recent years. Export energy trade is more widespread than import trade: the top seven recipient countries of U.S. energy exports accounted for only 57% of the total value of U.S. energy exports, compared with the top seven source countries of U.S. energy imports that accounted for 72% of the total value of U.S. energy imports.
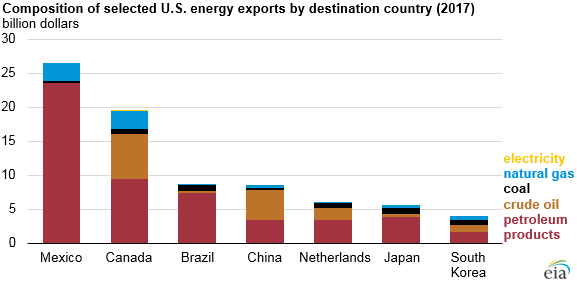
Petroleum products accounted for most of the exports for four of the top seven U.S. export recipient countries in 2017. Energy exports to China, Canada, the Netherlands, and South Korea had substantial shares of crude oil. In 2017, Mexico was the largest importer of natural gas from the United States, followed closely by Canada.
Principal contributors: Maggie Woodward, George Pantazopoulos, Natalie Kempkey