
East Coast refiners receiving more domestic crude oil from Gulf Coast by tanker and barge
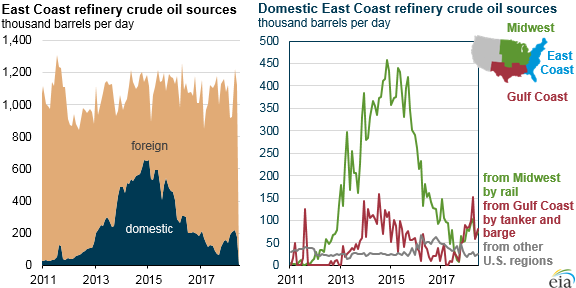
Since mid-2017, the East Coast has been receiving as much crude oil by tanker and barge from the Gulf Coast as it has by rail from the Midwest. In April, the volume of crude oil transported by tanker and barge from the Gulf Coast to the East Coast reached the highest level since mid-2014. At the same time, crude oil shipped to the East Coast by rail from the Midwest has fallen 77% from its peak in late 2014. These changes in crude oil shipments, as well as the mix between foreign and domestic crude oil inputs to East Coast refineries, have followed price movements in crude oil markets.
Changes to U.S. crude oil transportation infrastructure in the past three years, such as expanded pipeline capacity out of the Midwest (defined as Petroleum Administration for Defense District 2) and increased availability of coastwise-compliant shipping in the Gulf Coast (PADD 3), have altered the costs of transporting crude oil domestically.
Because very limited pipeline infrastructure exists to transport domestic crude oil to the East Coast (PADD 1), East Coast refiners historically have imported crude oil from international sources. For East Coast refineries, the price difference between the international benchmark Brent and the domestic benchmark West Texas Intermediate (WTI) helps determine when the additional costs of acquiring and transporting domestic crude oil to the East Coast can be overcome.
Between 2011 and 2015, when the difference in price between domestic crude oil and foreign crude oil was significantly greater than it had been in previous years, refineries on the U.S. East Coast increased receipts of domestic crude oil, particularly by rail and domestic marine shipping.
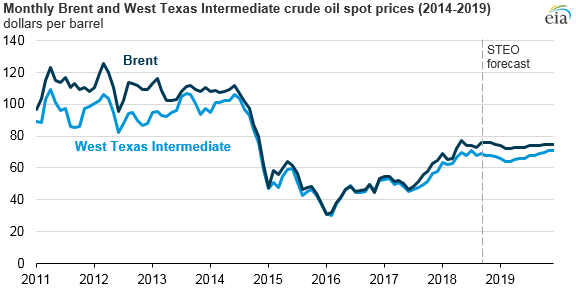
As the Brent-WTI price spread began widening to average $5 per barrel (b) in the first six months of 2018, East Coast refineries again increased their receipts of domestic crude oil, but this time in far lower quantities than in 2015. Domestic crude oil accounted for 19% of total East Coast crude inputs for the first six months of 2018, compared with 48% in the first six months of 2015, when the Brent-WTI price spread also averaged $5/b.
The completion of new pipelines since 2015 expanded the available options to move crude oil out of the Midwest and resulted in the decline in movements of crude oil by rail from that region. These pipelines included the Dakota Access Pipeline from the Bakken fields in North Dakota to Patoka, Illinois, and the Energy Transfer Crude Oil Pipeline (ETCO) from Patoka, Illinois, to Nederland, Texas. The expansion of pipeline capacity increased the share of crude oil transported from the Midwest by pipeline from 64% of the region’s total domestic crude oil shipments in June 2015 to 87% in June 2018.
In addition to these changes in infrastructure, East Coast refiners responded to the narrowing Brent-WTI price spread by canceling or not renewing domestic crude oil supply contracts they had made in previous years. Crude oil shipments by rail from the Midwest to the East Coast declined from 382,000 barrels per day (b/d) in June 2015 to 75,000 b/d in June 2018.
A buildout of new fleets of tankers and barges in the Gulf Coast has made shipping crude oil to the East Coast by water less expensive. Trade press reports indicate that a number of coastwise-compliant vessels were built in the past several years, helping to lower the costs of transporting domestic crude oil from the U.S. Gulf Coast to the East Coast compared with costs in 2015.
Going forward, the Brent-WTI price spread is expected to remain the primary factor affecting East Coast domestic crude oil receipts. In the September Short-Term Energy Outlook, EIA forecasts Brent will average about $6/b more than WTI in 2018 and in 2019.
Principal contributors: Kelsey Hallahan, Mason Hamilton, Kiefer Mueller
Tags: refining, Gulf Coast, liquid fuels, crude oil, oil/petroleum