
More than 30% of global maritime crude oil trade moves through the South China Sea
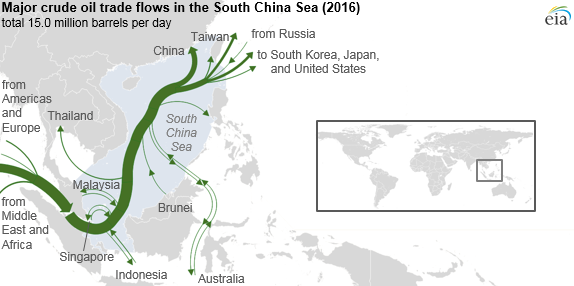
Note: Click to enlarge. Total includes small flows (less than 0.1 million barrels per day) not shown on map.
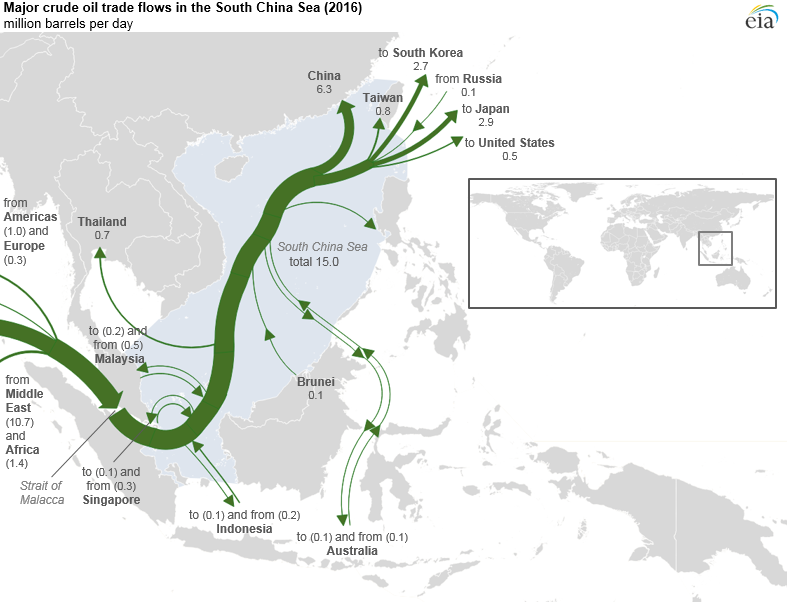
The South China Sea is a major trade route for crude oil, and in 2016, more than 30% of global maritime crude oil trade, or about 15 million barrels per day (b/d), passed through the South China Sea.
More than 90% of crude oil volumes flowing through the South China Sea in 2016 transited the Strait of Malacca, the shortest sea route between suppliers in Africa and the Persian Gulf and markets in Asia, making it one of the world’s primary oil transit chokepoints. In addition, a significant amount of crude oil (about 1.4 million b/d) passes through the strait on its way to Singapore and the west coast of Peninsular Malaysia, where it is refined before transiting the South China Sea in the form of petroleum products.
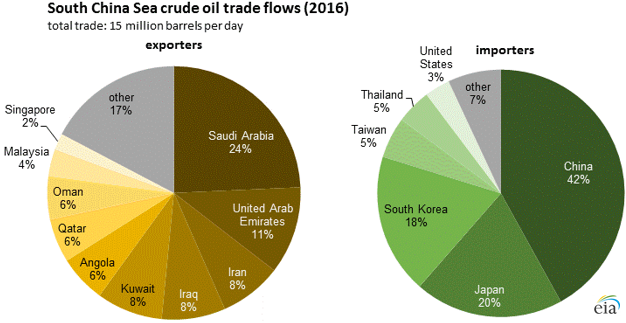
The South China Sea is a major trade route for the Middle East, which accounted for more than 70% of total South China Sea crude oil shipments in 2016. Saudi Arabia is the largest source of crude oil, making up almost one-fourth of crude oil volumes traversing the South China Sea. More than half of Saudi Arabia’s global crude oil shipments traveled through the South China Sea in 2016.
Before the lifting of United Nations sanctions on Iran’s crude oil exports in January 2016, Iran relied heavily on Asian markets for most of its exports. After the sanctions were lifted, Iran could once again export crude oil to Europe. However, the South China Sea route still accounted for 52% of Iran’s crude oil exports in 2016.
In addition to Middle Eastern and North African volumes, some regional countries bordering the South China Sea contribute to the overall shipments of crude oil through the region. Indonesia and Malaysia together accounted for 5% of crude oil loadings that passed through the South China Sea in 2016 and 2% of crude oil receipts. Most of the crude oil from these countries that passes through the South China Sea is exported to other countries. However, some intra-country trade also crosses the southern portion of the South China Sea as cargoes move between eastern and western ports within each country.
Singapore accounted for 2% of crude oil loadings that passed through the South China Sea in 2016 and 1% of crude oil receipts. Although Singapore does not produce crude oil, it is a major hub for refining crude oil and for storing and transshipping crude oil and petroleum products. In 2016, 95% of Singapore’s crude oil exports passed through the South China Sea. Most of these volumes originally came from the Middle East, and about half went to China.
The three crude oil importers with the largest volumes passing through the South China Sea—China, Japan, and South Korea—collectively accounted for 80% of total crude oil volumes transiting the South China Sea in 2016. About 90% of China’s 2016 maritime crude oil shipments were transported through the South China Sea. China’s crude oil imports have increased substantially over the past few years as a result of the country’s robust energy demand growth and stagnant crude oil production, and the country recently surpassed the United States as the world’s largest crude oil importer. A significant portion of these incremental volumes that are sent to northern China from eastern Russia by pipeline and by shipping vessels does not pass through the South China Sea.
About 90% of the crude oil imported by Japan and South Korea was shipped through the South China Sea in 2016. Most of Japan's and South Korea’s imports are from Middle Eastern suppliers and are transported through the Strait of Malacca and then the South China Sea.
Principal contributors: Candace Dunn, Justine Barden
Tags: China, exports/imports, liquid fuels, crude oil, map