Petroleum, natural gas, and coal still dominate U.S. energy consumption
Today in Energy would like to wish you a happy Fourth of July. New articles will resume on Monday, July 9.
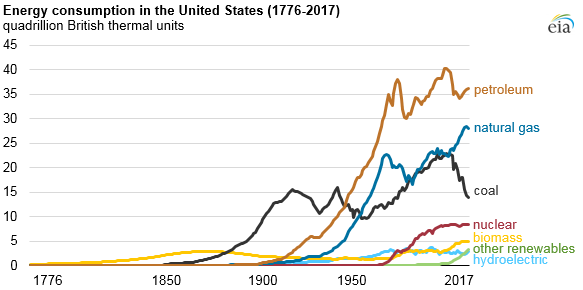
Fossil fuels—petroleum, natural gas, and coal—have accounted for at least 80% of energy consumption in the United States for well over a century. The fossil fuel share of total U.S. energy consumption in 2017 was the lowest share since 1902, at a little more than 80%, as U.S. fossil fuel consumption decreased for the third consecutive year.
The decline in fossil fuel consumption in 2017 was driven by slight decreases in coal and natural gas consumption. Coal consumption fell by 2.5% in 2017, following larger annual declines of 13.6% and 8.5% in 2015 and 2016, respectively. U.S. consumption of coal peaked in 2005 and declined nearly 40% since then.
Natural gas consumption fell by 1.4% in 2017, a change from recent trends. Unlike coal consumption, which has decreased in 8 of the past 10 years, natural gas consumption has increased in 8 of the past 10 years, and in 2017, was twice that of coal. Natural gas consumption growth has been driven by increased use in the electric power sector. Overall, U.S. consumption of natural gas increased by 24% from 2005 to 2017.
Petroleum consumption increased in 2017, but remains 10% lower than its peak consumption level, also set in 2005. Mainly used in the transportation sector, several petroleum-based fuels are also used in homes, businesses, and industries. Petroleum has been the largest source of energy consumption in the United States since surpassing coal in 1950.
The renewable share of energy consumption in 2017, which includes hydroelectricity, biomass, and other renewables such as wind and solar, was 11.3%, the highest since the late 1910s, when overall energy consumption was lower and biomass consumption—mainly wood—made up a larger share. The largest growth in renewables over the past decade has been in solar and wind electricity generation.
Energy consumption in the United States has undergone many changes over the course of the nation’s history, from wood as the primary resource in the 18th and 19th centuries, to the onset of coal and petroleum use, to the more modern rise of nuclear power in the late 20th century, and to renewables in the early 21st century.
Of course, EIA did not exist to collect data in 1776. The Monthly Energy Review's pre-1949 estimates of U.S. energy use are deeply indebted to two sources. Much of the data used in earlier energy estimates are from the book Energy in the American Economy 1850-1975, Its History and Prospects by Sam Schurr and Bruce Netschert. The U.S. Department of Agriculture’s Circular No. 641, Fuel Wood Used in the United States 1630–1930, published in 1942, provides some of the earliest biomass consumption estimates for the United States.
Appendix D of EIA’s Monthly Energy Review compiles these estimates of U.S. energy consumption in ten-year increments from 1635 through 1845 and five-year increments from 1845 through 1945. Data for 1949 through the present day can be found in the latest Monthly Energy Review.
Principal contributor: Michael Mobilia