Oil company additions to proved reserves in 2017 were the highest since 2013
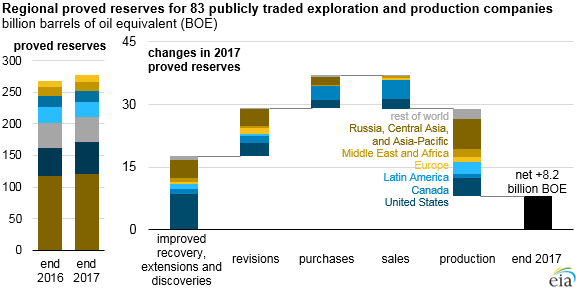
Note: Rest of world includes associated companies’ reserves with unspecified geographies.
In 2017, a group of the world’s largest publicly traded oil and natural gas producers added more hydrocarbons to their resource base than in any year since 2013, according to the annual reports of 83 exploration and production companies. Collectively, these companies added a net 8.2 billion barrels of oil equivalent (BOE) to their proved reserves during 2017, which totaled 277 billion BOE at the end of the year. Exploration and development (E&D) spending in 2017 increased 11% from 2016 levels but remained 47% lower than 2013 levels.
Of the 83 companies, 18 held more than 80% of the 277 billion BOE in proved reserves at the end of 2017. Although many of these companies have global operations, some are national oil companies with reserves concentrated in their home countries, including Russia, China, and Brazil. Proved reserves change from year to year because of revisions to existing reserves, extensions and discoveries of new resources, purchases and sales of proved reserves, and production.
Organic additions to proved reserves, or reserves added through improved recovery and extensions and discoveries, are linked directly with capital expenditures in E&D. Proved reserves acquired through purchases do not represent E&D capital investment but rather reflect transfers of assets between companies. Revisions to proved reserves are usually more significantly influenced by changes in crude oil and natural gas prices than by E&D investment.
Of the 17.7 billion BOE in organic proved reserves added in 2017, slightly less than half (8.5 billion BOE) were in the United States, while Russia, Central Asia, and the Asia-Pacific region accounted for 24% (4.3 billion BOE). Canada (which includes oil sands and synthetic crude oil), Latin America, and the Middle East and Africa regions each added more than 1.1 billion BOE. Regionally, Europe accounted for the fewest organically added proved reserves for the sixth consecutive year, adding 0.3 billion BOE (2% of world total) of proved reserves in 2017.
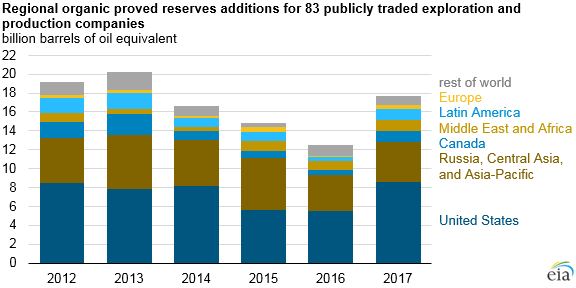
Note: Organic proved reserves additions include those added through improved recovery and extensions and discoveries. Rest of world includes associated companies’ reserves with unspecified geographies.
Global E&D spending by region was similarly distributed. Of the $285 billion companies spent on E&D in 2017, 33% ($95 billion) was in the United States, with the Russia, Central Asia, and Asia-Pacific region accounting for 30% ($85 billion) and all other regions each accounting for 10% or less. Changes in nominal year-over-year E&D spending varied across regions, increasing by 36% in the United States and by 15% each in Canada and the Russia, Central Asia, and Asia-Pacific region. Spending declined by 24% in Europe, 16% in the Middle East and Africa, and 15% in Latin America.
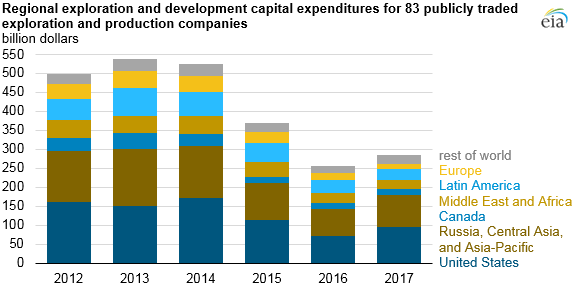
Note: Includes purchases of unproven reserves.
Because of a disparity between the timing of companies’ capital expenditures and the formal reporting of changes to their proved reserves, standard practice is to average the results over several years. Analyzed this way, E&D costs declined significantly on a per BOE basis from the 2012–2014 average to the 2015–2017 average. Three-year average E&D capital expenditures per BOE of organic proved reserves additions decreased in all regions except Latin America. On an annual basis, 2017 represented the lowest E&D capital expenditures per additional BOE to proved reserves during the 2012–2017 period at $16.12/BOE.
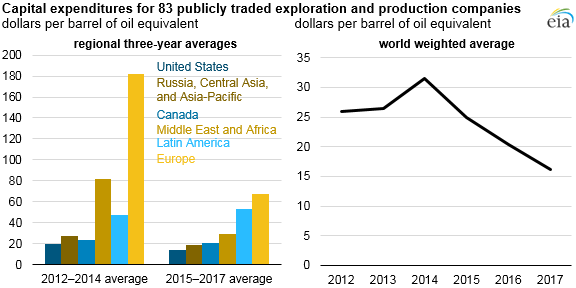
Note: Capital expenditures include expenditures on unproved reserves, exploration, and development.
First-quarter 2018 capital expenditures for this set of companies were 16% higher than in first-quarter 2017, suggesting that many of these companies have increased their E&D budgets, which will likely contribute to further organic proved reserves additions in 2018.
Principal contributor: Jeff Barron