Electrified vehicles continue to see slow growth and less use than conventional vehicles
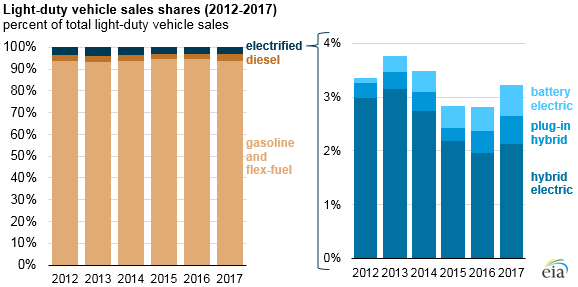
Note: Other fuel types such as hydrogen, propane, and compressed natural gas collectively accounted for less than 0.05% of light-duty vehicle sales in these years.
Electrified vehicles (hybrid electric, plug-in hybrid electric, and battery electric) have been sold as high fuel economy alternatives to conventional gasoline vehicles for a number of years but collectively have been slow to gain market share in the United States.
From 2012 through 2017, electrified vehicles consistently accounted for between 2.5% and 4.0% of total light-duty vehicle sales, even as the number of available models increased from 58 to 95. Hybrid electric vehicles accounted for the largest share of electrified vehicles, but their share of sales has fallen as plug-in hybrid electric (PHEVs) and battery electric vehicle (BEVs) shares have slightly increased.
The BEV share of total light-duty vehicle sales has grown the most since 2012 but only accounted for 0.6% of 2017 sales. The PHEV share grew from 0.1% to 0.5% and non-plug-in hybrid electrics declined from 3.0% to 1.9% of total light-duty vehicle sales between 2012 and 2017, based on Wards Automotive sales data.
Several factors may account for the limited growth in these vehicles. Gasoline prices have remained relatively low in recent years, and the fuel economy of conventional vehicles has increased—factors that diminished the potential fuel savings of switching to electrified vehicles. Initial purchase prices for many electrified vehicles remain relatively high, especially for several PHEV and BEV models, despite federal and state incentives. Also, in most locations, limited charging infrastructure for plug-in vehicles has hindered wider adoption.
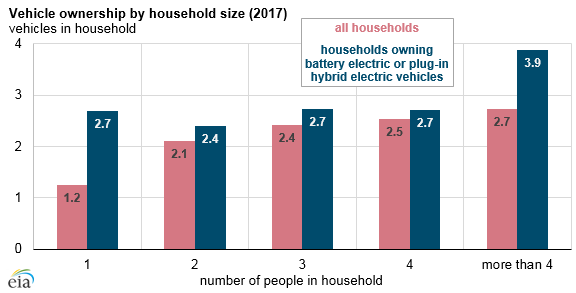
Data from the 2017 National Household Travel Survey conducted by the U.S. Department of Transportation offers insight into the use and ownership of electrified vehicles. Households that own BEVs and PHEVs tend to have more vehicles per household, owning 2.7 vehicles compared with the household average of 2.1 vehicles. BEVs and PHEVs also tend to be used about 12% less than other vehicles in terms of annual mileage per vehicle.
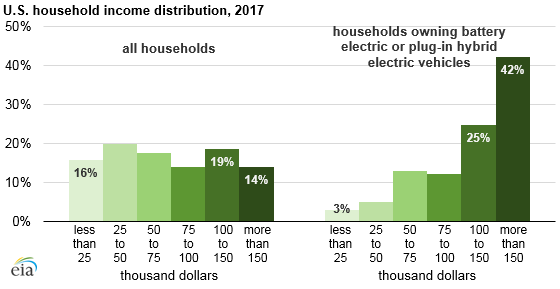
About one-third of all households have annual incomes higher than $100,000. However, about two-thirds of households with BEVs or PHEVs have incomes higher than $100,000. Households with annual incomes lower than $25,000 account for about 16% of all households but about 3% of BEV- and PHEV-owning households.
Principal contributor: David Stone
Tags: diesel, electricity, gasoline, liquid fuels, transportation, vehicles