Electricity demand by U.S. manufacturing has declined in recent years
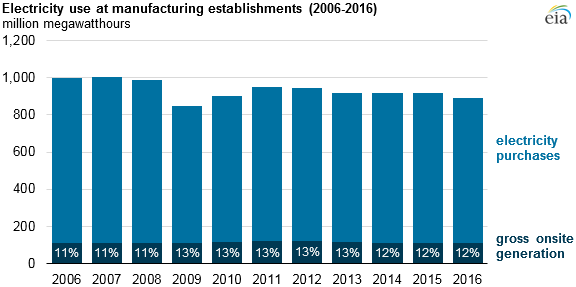
Overall electricity use in U.S. manufacturing has declined in recent years, based on data from the U.S. Census Bureau. Many manufacturing establishments have the option of generating their own electricity in addition to pulling directly from the electric grid to run their processes. Most operators get their electricity from grid purchases. From 2006 through 2016, the manufacturing sector purchased 87% to 89% of their electricity from the grid and generated the remaining 11% to 13% onsite.
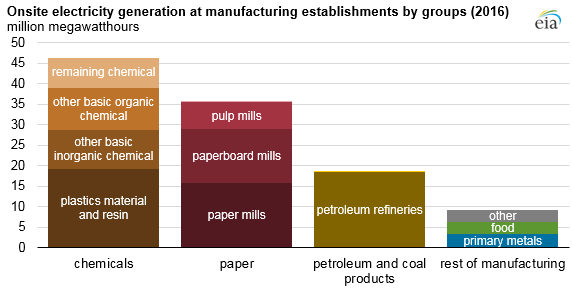
Highly efficient industrial onsite generation from combined heat and power (CHP) technology offers the potential for increased system resiliency and operational benefits, but it is concentrated in just a few manufacturing groups. In 2016, the entire manufacturing sector generated 110 million megawatthours (MWh) of electricity, driven in part by federal tax incentives and state initiatives. About 97% of this electricity came from five manufacturing groups: chemicals, paper, petroleum and coal, primary metals, and food.
Detailed electricity statistics from the U.S. Census Bureau’s Annual Survey of Manufactures show how onsite electricity generation is concentrated in certain parts of these five industrial groups:
- Chemical manufacturing generated 46 million MWh of onsite generation, mostly concentrated in three sub-groups: other basic inorganic chemical manufacturing, other basic organic chemical manufacturing, and plastics material and resin manufacturing.
- Paper manufacturing’s onsite generation is concentrated in pulp mills, paper mills, and paperboard mills, which collectively provided 35 million MWh, or nearly all of paper manufacturing’s onsite generation.
- Petroleum and coal product manufacturing’s 19 million MWh of onsite electricity generation is nearly all generated by petroleum refiners.
The federal government—as part of the Consolidated Appropriations Act of 2016 and the Bipartisan Budget Act of 2018—has extended through the end of 2021 a tax credit for 10% of combined heat and power construction expenditures, with no maximum limit stated.
Principal contributor: Mark Schipper