Average wholesale spot natural gas prices rose across the country in 2010
Published By: U.S. Energy Information Administration
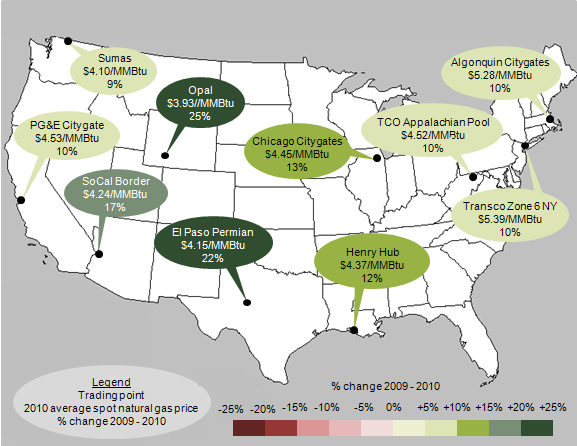
Wholesale spot natural gas prices rose across the country in 2010. Average spot natural gas prices at the Henry Hub—a key benchmark location for pricing throughout the United States—rose about 12% in 2010 but still averaged under $4.50 per million British thermal units (MMBtu).
The average annual spot natural gas price at the Henry Hub, derived from InterContinental Exchange data, rose 12% from $3.92 per MMBtu in 2009 to $4.37 per MMBtu in 2010 mainly because of higher natural gas consumption. A colder-than-normal start and finish to the year—punctuated by a sustained summer heat wave in the Eastern half of the country—contributed to higher prices. The continuing economic recovery, which boosted natural gas demand by about 6% in the industrial sector, also contributed to higher prices. Despite this increase, prices were much lower than average annual prices at Henry Hub for any year between 2003 and 2008.
Wholesale natural gas prices at major hubs climbed $0.33-$0.83 per MMBtu from 2009 to 2010. The highest prices in the United States were in the far Northeast (e.g., New York and New England), averaging over $5.00 per MMBtu due to remaining pipeline constraints within part of the Northeast. However, continued growth in gas infrastructure elsewhere reduced bottlenecks on the grid, bringing Eastern and Western prices closer together.
In 2010, some key regional distinctions were:
- The TCO Appalachia Pool hub—the Northeast trading point most directly affected by gains in Marcellus production (up about 1 billion cubic feet per day in 2010)—reflected just a $0.15 per MMBtu premium to the Henry Hub and was the lowest-priced, highly liquid major Northeast regional trading point.
- Hubs in the Southwest, Rockies, and Midcontinent regions registered the biggest gains, up about $0.60-$0.80 per MMBtu as the extension of the Rockies Express Pipeline, linking Western Wyoming gas fields to markets in Eastern Ohio and beyond, led to a greater convergence of Eastern and Western prices.
- Northwestern natural gas prices increased the least.
- Most Gulf Coast prices increased in line with Henry Hub; typical gas transportation costs from East Texas to Georgia remained low.
Tags: map, natural gas, prices, wholesale prices