Future U.S. electricity generation mix will depend largely on natural gas prices
The mix of fuels used to generate electricity in the United States has changed in response to differences in the relative costs of electricity-generating technologies and, for those technologies that consume fuel, the cost of fuel. Several cases in EIA’s Annual Energy Outlook 2018 (AEO2018) show how projected generation and capacity could continue to be affected by fuel price patterns, particularly for the price of natural gas. In a sensitivity case with low natural gas prices, natural gas ultimately provides more than half of all U.S. electricity generation by the mid-2040s.
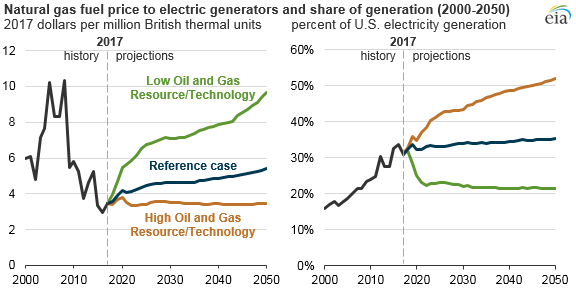
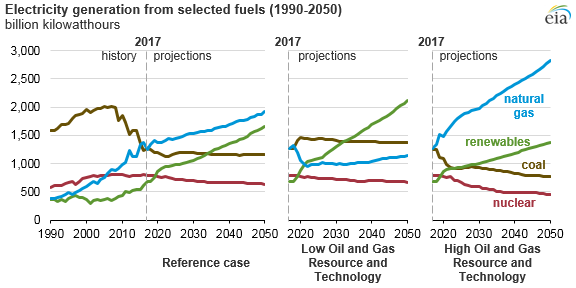
Natural gas recently surpassed coal as the main fuel used to generate electricity in the United States. In the AEO2018 Reference case, natural gas remains the leading source of electricity generation through 2050. By 2050, natural gas accounts for 35% of total electricity generation, a slight increase from its 2017 share of 31%.
In the Reference case, electricity generation from coal and nuclear gradually decline and lose market share to natural gas and renewables. Renewable generation surpasses nuclear by 2020 and surpasses coal by the mid-2030s as tax credits and lower capital costs drive solar photovoltaic and wind capacity additions.
The natural gas share of U.S. electricity generation largely depends on natural gas prices. The price of natural gas delivered to electric power plants averaged $3.47 per million British thermal units (Btu) in 2017 and in the AEO2018 Reference case is projected to be (in real dollar terms) $5.42 per million Btu in 2050. In the Low Oil and Gas Resource and Technology case, higher extraction costs and lower resource availability result in less natural gas production, and the natural gas price for power plants increases to nearly $10 per million Btu.
Conversely, in the High Oil and Gas Resource and Technology case, which has the opposite assumptions for resource extraction costs and availability, natural gas prices are projected to remain well below $4.00 per million Btu through 2050. Relatively low natural gas prices lead to higher utilization of existing plants and to more natural gas power plant construction.
Natural gas-fired generation in the High Oil and Gas Resource and Technology case is considerably higher than in the Reference case, displacing both renewable and coal-fired generation. Because of lower natural gas prices, natural gas-fired plants exceed renewables as the leading source of new capacity additions, and more existing coal-fired generation capacity is retired. Nuclear-powered electricity generation is also lower in the High Oil and Gas Resource and Technology case, because about half of the current nuclear power plant fleet retires by 2050.
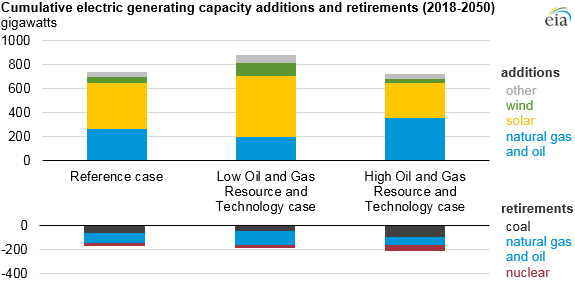
Conversely, in the relatively high natural gas price environment in the Low Oil and Gas Resource and Technology case, electricity generation from both renewable and coal-fired plants gains market share as the natural gas share declines. Renewable technologies become the predominant source of electricity generation in this case, surpassing natural gas-fired and then coal-fired plants as the primary source of generation by the mid-2030s. Coal-fired generation remains relatively high because of fewer retirements and higher utilization rates for existing coal-fired generating plants.
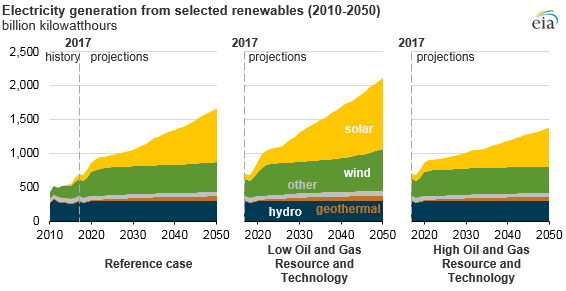
In the Low Oil and Gas Resource and Technology case, renewable generation increases because of greater additions of solar photovoltaic and wind capacity. In this case and in the Reference case, most of the new capacity is powered by solar. In the Low Oil and Gas Resource and Technology case, solar and wind provide 20% and 11% of U.S. electricity generation by 2050, respectively.
Principal contributors: Jeff Jones, Laura Martin