
Hydroelectric generation in Montana recovers from last summer’s flash drought
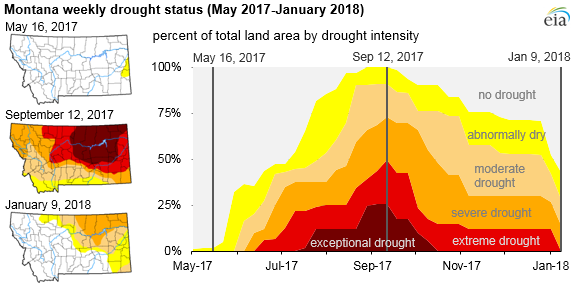
Montana experienced exceptionally hot and dry conditions last summer, which resulted in wildfires and a flash drought—an unpredictable drought that intensified very quickly. As a result, the hydropower share of the state’s electricity generation dropped below normal levels. Since peaking in September, the drought has receded, and hydropower generation in the state has recovered to levels consistent with previous years.
The drought began in the eastern part of the state in mid-May, with the state declaring a drought emergency in 20 counties. After intensifying for several months, the drought peaked in mid-September. At its peak, half of the state was classified in the two most severe drought categories in the Department of Agriculture’s U.S. Drought Monitor—exceptional drought or extreme drought.
As of January 9, 2018, no portion of the state remains in either of the two most severe categories, but 9% of the state is still classified as being in a severe drought. Although most of Montana’s hydropower plants are located in the western half of the state, farthest from the most severely affected eastern areas, the drought still had a noticeable impact on hydropower production.
Montana produces about twice the amount of electricity consumed in the state and exports the rest to neighboring states. Hydroelectricity is the second-largest source of electricity generation in the state, behind only coal. As of 2016 Montana had 2,665 megawatts of conventional hydropower capacity, which provided an average of 36% of Montana’s total generation (including exports).
When hydropower generation in Montana is reduced, electricity demand in the state is met by increased generation from coal, and to a lesser extent, from wind and natural gas.
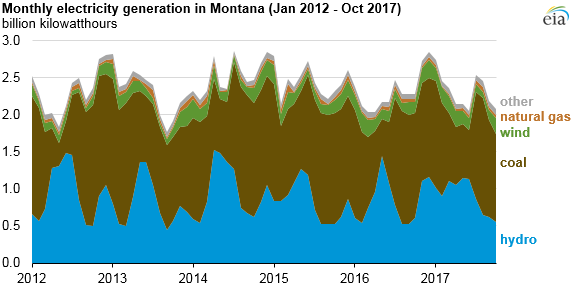
Hydroelectricity generation in Montana fluctuates throughout the year, typically peaking during the spring and early summer months as melting snowpack (winter accumulation) fuels hydroelectric plants. Over the past 15 years, hydropower has contributed as much as 60% of the state’s total electricity generation in July—the month with the highest summer electricity demand. In 2017, however, hydropower only generated 32% of the state’s electricity in July.
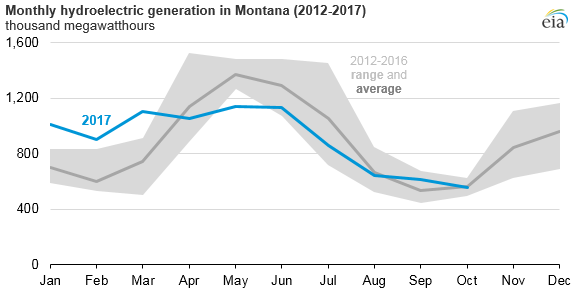
Montana’s hydroelectric generation during the first three months of 2017 was above the previous five-year range. During the spring, however, when snowpack melts and hydroelectric generation typically increases, the onset of the drought kept hydroelectric generation relatively flat. By May, hydroelectric generation was 10% below the lowest May generation of the previous five years. In September and October 2017, Montana’s hydroelectric generation has been closer to previous five-year average levels.
Principal contributors: Michelle Bowman, Cara Marcy