
U.S. gasoline prices increased in 2017
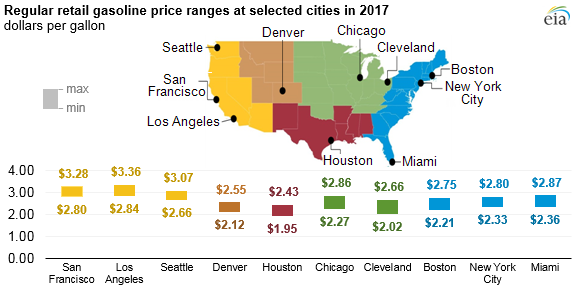
U.S. regular retail gasoline prices averaged $2.41 per gallon (gal) in 2017, 27 cents/gal (13%) higher than in 2016, but two cents/gal less than in 2015. Higher crude oil prices in 2017 contributed to higher gasoline prices. In 3 of the 10 cities for which EIA collects weekly retail price data, gasoline prices exceeded $3.00/gal at least once in 2017, and prices in every city except Houston exceeded $2.50/gal at some point in the year. On August 25, the landfall of Hurricane Harvey resulted in refinery and infrastructure outages in the Gulf Coast, which led to increased gasoline prices, particularly along the East Coast and Gulf Coast.
Each Monday, EIA collects and publishes data on retail gasoline and diesel fuel prices for 10 cities, 9 states, 5 regions, and the United States as a whole. Gasoline prices across the country reflect differences in gasoline specifications, taxes, and supply and demand balances in regional markets.
East Coast (Boston, New York, and Miami). In Boston and New York, regular retail gasoline prices were lowest in March, while prices in Miami were lowest in July. Florida’s consumption of transportation fuels is elevated by the tourism industry, which creates high seasonal consumption for highway and airline travel from out-of-state visitors. In all three cities, regular retail gasoline prices reached annual highs in September after Hurricane Harvey made landfall. Average prices for the entire East Coast region moved within a range of $2.20/gal to $2.73/gal over the year.
Midwest (Chicago and Cleveland). The Midwest covers a large geographic area consisting of many semi-connected markets. Retail gasoline prices in the Midwest were lowest in July, and they peaked in November as a result of higher crude oil prices, tight inventories, and strong demand. Repair work to refineries that was delayed as a result of Hurricane Harvey and the partial shutdown of the Explorer pipeline limited the gasoline supply in the region and contributed to the price increase in November. Prices in Chicago were slightly higher than prices in Cleveland and the Midwest regional average in every week during 2017. Of the cities for which EIA collects data, Cleveland’s gasoline prices were the lowest in the country for 3 weeks in 2017 and the second lowest in the country for 32 weeks.
Gulf Coast (Houston). Gulf Coast retail gasoline prices tend to be the lowest in the country. The region is home to half of U.S. refining capacity and produces substantially more gasoline than it consumes. In addition, gasoline taxes in the region are among the lowest in the country. Retail gasoline prices in Houston were the lowest of the 10 cities for which EIA collects data for 49 weeks in 2017. After Hurricane Harvey made landfall, gasoline prices in Houston rose, hitting an annual high of $2.43/gal in September. Gasoline prices in Houston were lowest the week of July 10 at $1.95/gal.
Rocky Mountains (Denver). Denver retail gasoline prices were the second lowest of the 10 cities surveyed for 17 weeks of 2017. Regional gasoline inventories were higher than the five-year average and pushed down prices for the first half of the year. However, inventories fell in the second half of the year and are currently below their five-year averages, contributing to higher gasoline prices compared with the same time last year.
West Coast (Los Angeles, San Francisco, and Seattle). Gasoline prices on the West Coast tend to be higher than in other parts of the country because of strict fuel specifications in California, the region's relative isolation from other markets, and higher state and local taxes. On November 1, California raised taxes on gasoline by 12 cents/gal, which resulted in higher 2017 gasoline prices compared with prices in 2016. Of the 10 cities for which EIA collects data, retail prices in San Francisco were the highest for all but 13 weeks of 2017. San Francisco prices peaked in November at $3.28/gal.
Principal contributor: Matt French
Tags: gasoline, liquid fuels, prices