
Winter supply disruptions from well freeze-offs can rival effects of summer storms
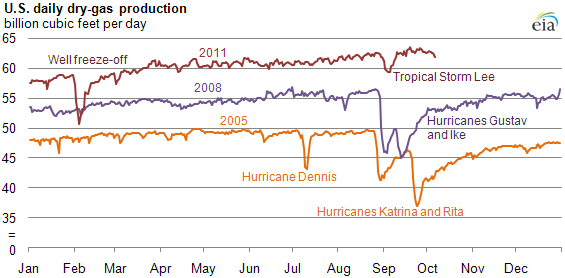
As more domestic U.S. natural gas production shifts from offshore fields in the Gulf of Mexico (GOM) to onshore basins, potential natural gas supply disruption risks have shifted as well. For many years, tropical storms and hurricanes in the GOM occurring in the summer and fall were the principal weather-related threat to natural gas production. Tropical Storm Lee in early September 2011 and the hurricanes of 2005 and 2008 illustrate that weather can reduce natural gas supplies, at least for short durations, by 2.5 to over 12 billion cubic feet per day (Bcf/d). Much colder than normal weather in the Southwestern United States in early February 2011 curtailed over 7 Bcf/d of natural gas production due to well freeze-offs (see chart); this disruption rivaled losses from major summer storms.
Although there can be similarities in initial supply curtailment, there are important distinctions between well freeze-offs and hurricane disruptions.
- Magnitude. Historically, hurricanes have the potential to curtail much more production—over 12 Bcf/d for Katrina and Rita, based on Bentek Energy data. Freeze-offs have been smaller both in peak-level and duration of supply lost, however losses from the most recent freeze-off in the Southwest rivaled hurricane proportions, at least for a few days.
Event Estimated Peak Supply Disruption (Bcf/d) Hurricane Dennis 6.1Hurricanes Katrina and Rita 12.2Hurricanes Gustav and Ike 9.5February Freeze-offs 7.5Tropical Storm Lee 2.5Source: U.S. Energy Information Administration, based on Bentek Energy, LLC.
Note: Values are calculated using the average daily dry-gas production
for the 30-day period that preceded the event minus the lowest daily dry-gas
production during the event. - Timing. Hurricane season occurs in the summer and fall, whereas freeze-offs are more likely to occur in the winter when natural gas demand is usually highest.
- Duration. Hurricane outages can last for months, with some wells never returning to service. Freeze-offs tend to end quickly with production returning as temperatures rise.
- Location. While hurricanes affect production almost solely in the Gulf of Mexico region, freeze-offs can potentially occur over a wider area. The February 2011 event ranged from Texas to Arizona.
Tags: natural gas, offshore, production/supply, weather