WPSR provides comprehensive crude oil and refined products balances
Today in Energy features this story explaining the Weekly Petroleum Status Report (WPSR) and a separate story explaining the Weekly Natural Gas Storage Report (WNGSR). Together, these stories describe how EIA conducts surveys and publishes reports on two widely-followed sets of energy market information.
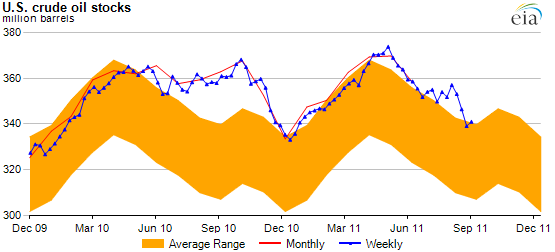
EIA's Weekly Petroleum Status Report (WPSR) is the most comprehensive weekly data available for U.S. crude oil and refined petroleum product balances. The chart highlights an example of recent levels of U.S. crude oil stocks and their relationship to typical levels for this time of year reported in the WPSR. Many industry observers closely follow WPSR data; significant trading in commodity markets occurs immediately after the WPSR's release every Wednesday at precisely 10:30 a.m. Eastern Time (with the exception of certain weeks with holidays).
The WPSR provides detailed regional and national supply information each week on motor gasoline, distillate fuel oil, kerosene jet fuel, residual fuel and propane, the major petroleum products used in the United States, as well as other lesser-followed petroleum products.
Petroleum is a major source of energy in the United States, representing about 40% of total annual energy consumption. Petroleum and financial analysts rely on the WPSR's extensive weekly surveys of production, inputs, imports, and inventories of crude oil and petroleum products to assess domestic petroleum supplies as the closest source of real-time information for estimating U.S. petroleum demand.
The WPSR uses seven surveys to collect data from roughly 1,200 respondents across the primary petroleum supply chain made up of refineries, pipelines, bulk and blending terminals, gas processing plants and fractionators, oxygenate producers, and importers. These respondents comprise a sample selected from the comprehensive universe of respondents who report to EIA monthly on similar forms for the Petroleum Supply Monthly. The WPSR survey forms are:
- EIA-800, Weekly Refinery and Fractionator Report (~150 respondents)
- EIA-801, Weekly Bulk Terminal Report (~170 respondents)
- EIA-802, Weekly Product Pipeline Report (~50 respondents)
- EIA-803, Weekly Crude Stocks Report (~50 respondents)
- EIA-804, Weekly Imports Report (~100 respondents)
- EIA-805, Weekly Bulk Terminal and Blender Report (~500 respondents)
- EIA-809, Weekly Oxygenate Report (~150 respondents)
Each survey form collects information on a variety of products, such as motor gasoline, distillate fuel oil or kerosene jet fuel, and supply types, which include inputs, production, stocks and imports. In instances when a survey form contains data for multiple locations or spans several parts of the country (as is the case with pipelines), volumes are presented for each of the five Petroleum Administration for Defense Districts (PADD).
Analysts review and aggregate the data across surveys to determine the overall volumes of crude oil and petroleum products by PADD and supply type. The full report contains a considerable amount of data, including these closely watched indicators:
- U.S. Commercial Crude Stocks (excludes volumes held in the Strategic Petroleum Reserve, which are reported separately)
- Cushing Crude Stocks – Cushing, Oklahoma is the physical market hub for West Texas Intermediate (WTI) that is the basis for oil futures contracts traded at the New York Mercantile Exchange
- Total Motor Gasoline Stocks
- Percent Utilization of Refinery Operable Capacity
- Finished Motor Gasoline Product Supplied
- Total Product Supplied
Often, analysts use WPSR data on product supplied as a proxy for demand because it measures the removal of petroleum products from the primary supply chain.
For all petroleum products grouped together:
product supplied = (crude oil inputs to refineries + other supply production + net imports) - stock change.
The stock change would be minus stock additions or plus stock draws.
For specific refined petroleum products:
product supplied = production + imports - stock change - exports.
The stock change would be minus stock additions or plus stock draws.