
Widening Brent-WTI price spread unlikely to change East Coast crude oil supply
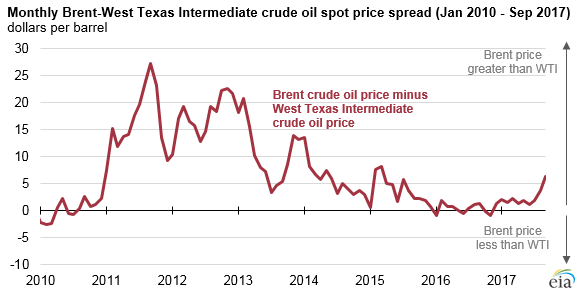
In September and October 2017, the difference between domestic and foreign crude oil prices has risen to the highest level since 2015. In the past, price differences between West Texas Intermediate (WTI) and Brent crude oil led to changes in crude oil supply for petroleum refineries in the U.S. East Coast region. However, recent price changes are not expected to affect East Coast crude oil supply unless the gap continues and widens.
Between 2011 and 2013, when domestic crude oil prices (WTI) ranged from $3 per barrel (b) to $27/b lower than foreign crude oil (Brent) on a monthly average basis, refineries on the U.S. East Coast changed how they were supplied with crude oil. The recent price spread, which has averaged $6/b in September and October, has not grown large enough—and is not expected to last long enough—for changes similar to those seen between 2011 and 2013.
For U.S. East Coast refineries, the Brent-WTI spread can partially determine when switching to domestic crude oil would be more profitable. Before 2011, refineries on the U.S. East Coast (defined as Petroleum Administration for Defense District 1) typically processed imported crude oil because transportation options for sourcing domestically produced crude oil were limited and relatively expensive.
Between 2011 and 2013, U.S. crude oil production grew faster than transportation, storage, and refining capacity could accommodate, and restrictions on exporting domestically produced crude oil led to relatively low prices for WTI compared with Brent. The large and prolonged domestic crude oil price discount from 2011 to 2013 prompted East Coast refineries to source domestic crude oil by coastwise-compliant shipping arrangements and by investing in crude-by-rail projects, among other means.
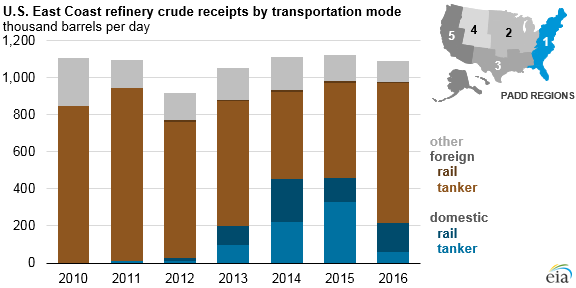
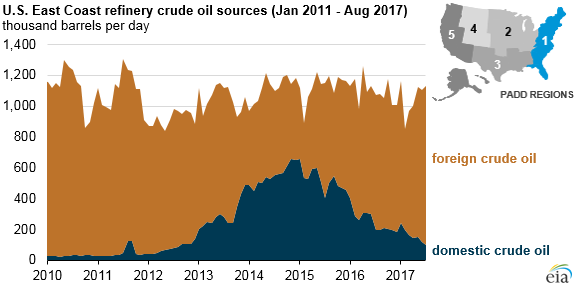
These investments resulted in a major shift in East Coast crude oil supply trends. In January 2014, domestic crude oil receipts equaled receipts of foreign crude oil into East Coast refineries for the first time. Domestic crude oil receipts accounted for as much as 60% of total East Coast refinery crude oil receipts in February 2015.
However, the Brent-WTI spread narrowed throughout the rest of 2015. In 2016, the price difference between the two crude oils averaged less than $1/b. East Coast refiners responded by canceling or not renewing domestic crude oil supply contracts, and domestic crude oil receipts at East Coast refineries decreased from a high of 535,000 barrels per day (b/d) in February 2015 to 101,000 b/d in July 2017.
Other factors have changed since the 2011–2013 period. Crude oil suppliers to East Coast refineries have found other outlets for their crude oil, such as refineries in other regions and export markets. Expanded pipeline infrastructure has given domestic crude oil producers access to refiners in the Midwest and Gulf Coast regions, reducing the need to ship crude oil by rail.
In December 2015, restrictions on exporting domestic crude oil were removed, so East Coast refiners must now compete with international buyers for domestic crude oil, and pay the typically higher coastwise-compliant shipping rates for a U.S. Gulf Coast-to-U.S. East Coast tanker shipment. U.S. East Coast refiners are unlikely to repeat shifts in crude oil supply patterns despite the widening price difference.
Additional information about factors that affect East Coast crude oil supply—and how those factors differ from those present in 2011 through 2013—is discussed in the latest This Week in Petroleum.
Principal contributor: Mason Hamilton