Haynesville shale gas production increases to highest levels since end of 2013
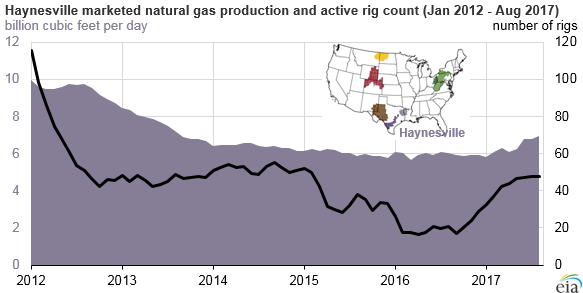
Recent increases in drilling activity and well production rates are raising natural gas production levels in the Haynesville region, according to EIA’s Short-Term Energy Outlook (STEO). Marketed natural gas production in Haynesville reached 6.9 billion cubic feet per day (Bcf/d) in September after remaining near 6.0 Bcf/d for the previous three years. The recent growth in Haynesville natural gas production is attributable to an increase in the number of active drilling rigs (starting late in 2016) and a trend toward higher per-well initial production rates.
The United States Geological Survey estimates that the Haynesville shale play holds 174.6 trillion cubic feet of technically recoverable shale gas resources, the second-largest level in the United States after the Appalachia region.
Compared with Appalachian resources, Haynesville natural gas reservoirs are farther underground. Most Haynesville producing wells are in areas where the formations have depths ranging from 10,000 feet to 14,000 feet below sea level. In the Appalachian region, wells are in areas where formations are 2,000 feet to 12,000 feet below sea level. Haynesville shale formation thickness is also slightly narrower, ranging from 100 feet to 350 feet, compared with Appalachia, where shale thickness ranges from 50 feet to 400 feet.
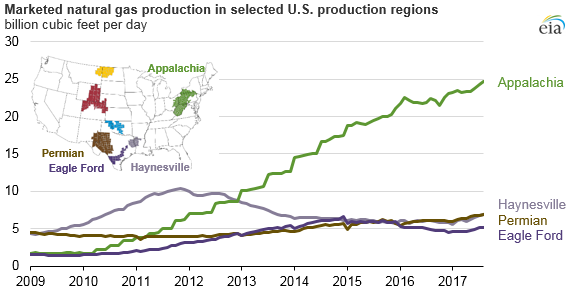
From 2009 to 2012, the Haynesville region was the largest shale gas-producing region in the country. In November 2011, Haynesville regional production reached a record high of 10.4 Bcf/d. In early 2013, however, as natural gas prices started to decrease, natural gas production in the Haynesville region was surpassed by production in the Appalachian region, which includes the Marcellus and Utica formations. By late 2015, shale gas production from relatively liquids-rich areas such as the Eagle Ford region in Texas and the Permian region, which spans parts of western Texas and eastern New Mexico, also started to surpass production from the Haynesville region.
Per-well production from new wells in the Haynesville region has also increased since 2013. Drilling operators in the region have increased the lateral length of horizontal wells beyond 7,000 feet, added more fracturing stages, and significantly increased the quantity of proppant used in completion activities.
Principal contributors: Faouzi Aloulou, Danya Murali
Tags: Haynesville, natural gas, production/supply, rig count, shale, wells