
Crude oil and petroleum product exports reach record levels in the first half of 2017
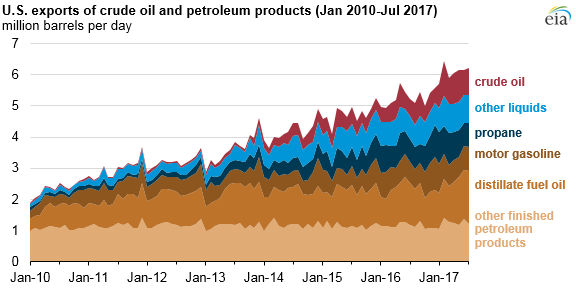
Crude oil exports in the first half of 2017 increased by more than 300,000 barrels per day (b/d) from the first half of 2016, reaching a record high of 0.9 million b/d. Petroleum product exports also grew over the same period with propane and distillate exports reaching record highs of 0.9 million b/d and 1.3 million b/d, respectively.
Following the removal of restrictions on exporting U.S. crude oil in December 2015, total volumes of crude oil exports and the number of destinations for those exports both increased. The United States exported crude oil to 27 countries in the first half of 2017 compared with 19 countries in the first half of 2016.
Canada remained the largest recipient of U.S. crude oil exports at 307,000 b/d, but imported an average of 63,000 b/d less compared with the first half of 2016. China increased its crude imports from the United States by 178,000 b/d and became the second largest importer of U.S. crude oil, averaging 186,000 b/d in the first half of the year.
Distillate exports in the first half of 2017 were 14% higher than in the first half of 2016, with exports to South and Central America accounting for most of this growth. The share of distillate exports to Central and South America increased slightly to 56%, while the share of distillate exports to Western Europe fell to 19%. Mexico remained the largest single destination for U.S. distillate, averaging 17% of total exports (223,000 b/d), followed by Brazil and the Netherlands.
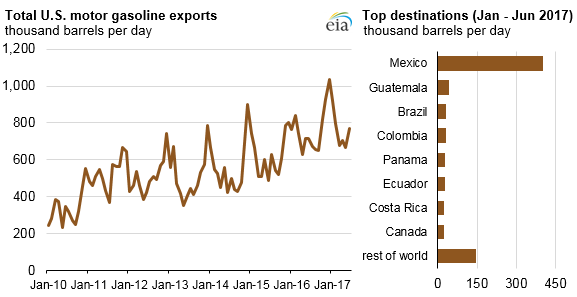
In the first half of 2017, despite consistently strong domestic demand, U.S. exports of total motor gasoline averaged a record high of 756,000 b/d, a 3% increase from the first half of 2016. High levels of domestic production of gasoline contributed to this record-high export level.
Mexico was the destination of more than half (53%) of total U.S. gasoline exports in the first half of 2017. Recent market reforms in Mexico, which allow entities other than state-owned Pemex to import petroleum products, may have contributed to the recent growth in Mexico’s gasoline imports from the United States. Although Mexico produces large amounts of crude oil, Mexico’s refinery output of products such as gasoline has been declining since 2015.
In the first half of 2017, Mexico experienced unexpected refinery outages that reduced production of gasoline and distillates even further, and U.S. exports of gasoline to Mexico increased by 27,000 b/d compared with the first half of 2016.
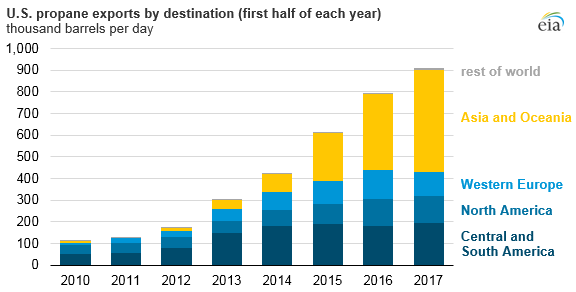
U.S. propane exports reached a record high of 913,000 b/d in the first half of 2017, up from 790,000 b/d in the first half of 2016. Most of this increase is from U.S. exports to Asian markets, which accounted for 74% of the growth since the first half of 2016 and now make up a majority of the destination countries for U.S. propane exports
Principal contributors: Matthew French, Joseph Ralbovsky