
Northwest heat wave leads to record levels of summer electricity demand
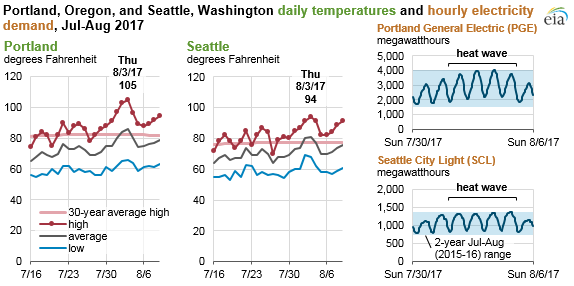
Multiple record-breaking heat waves swept across the western United States this summer, with the latest occurring in the Pacific Northwest from August 1–4, 2017. Coincident with the hot weather, some of the largest electricity balancing authorities in the area experienced record-high summer electricity demand on their systems.
In the region’s largest cities, the highest temperatures were seen on Thursday, August 3, when Portland reached 105 degrees and Seattle reached 94 degrees. These highs were 23 degrees and 17 degrees higher than the 30-year (1981–2010) average highs for that day for Portland and Seattle, respectively. Despite the proximity of the cities, Seattle’s summer temperatures can be notably lower than Portland’s because of the nearby Puget Sound and the Pacific Ocean’s moderating effect on Seattle’s climate.
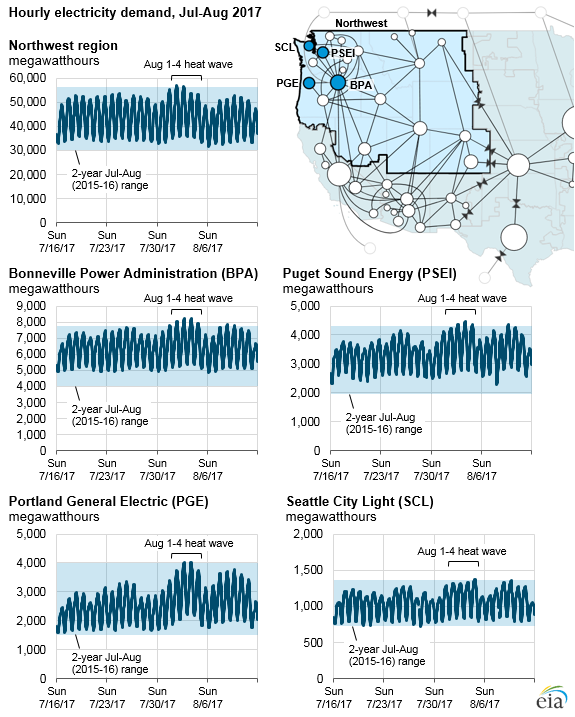
Note: The map illustrates the general location of the balancing authorities. See a more detailed map of service areas.
Bonneville Power Administration (BPA) is a federal power marketing administration that supplies large volumes of hydropower to other balancing authorities in the region. BPA broke its previous summer peak demand record of 7,861 megawatts (MW) from 2014 every day between August 1–3, with the highest peak of 8,226 MW occurring on Wednesday, August 2, 2017.
Portland General Electric (PGE) serves about 45% of Oregon’s population, including most of Portland and its metropolitan area. PGE set a new summer peak demand record of 3,967 MW on Wednesday, August 2, only about 100 MW lower than PGE’s all-time peak demand of 4,073 MW from December 1998.
Seattle City Light (SCL) serves the city of Seattle and, with Puget Sound Energy, Inc (PSEI), most of its surrounding areas. These utilities saw higher demand during the heat wave than in the previous two July–August periods but did not exceed their historical summer peak records, which occurred in July 2009 when temperatures in the area reached 103–104 degrees.
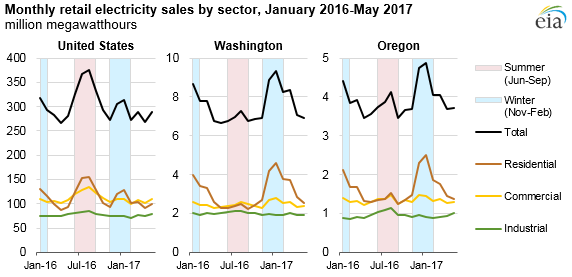
Unlike most of the country, many electric systems in the Northwest are winter-peaking, meaning their highest electricity demand usually occurs in the winter during the heating season. The Northwest typically experiences mild summers, leading to lower cooling-related electricity usage compared with other regions.
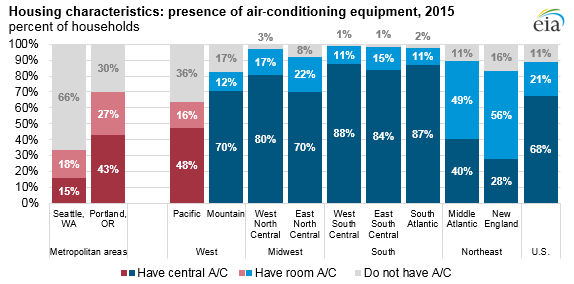
The Northwest region also has a relatively large percentage of homes without air conditioning, further reducing the impact of hot weather on electricity usage in the summer. Although 89% of homes in the United States have some form of air conditioning, only 34% and 70% of homes in Seattle and Portland, respectively, have air conditioning.
Principal contributor: April Lee