
Brent and WTI crude oil prices expected to average about $50 per barrel through 2018
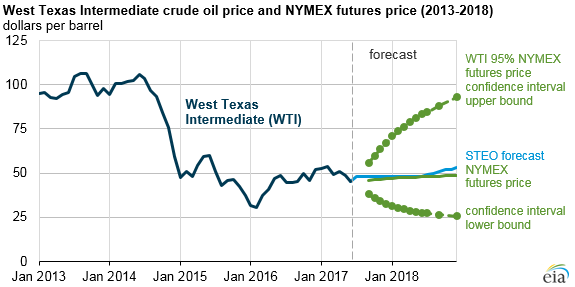
Note: Confidence interval derived from options market information for the five trading days ending July 6, 2017. Intervals not calculated for months with sparse trading in near-the-money options contracts.
EIA now forecasts Brent crude oil spot prices to average $51 per barrel (b) in 2017 and $52/b in 2018. West Texas Intermediate (WTI) crude oil prices are expected to be $2/b lower than Brent prices in 2017 and 2018. Daily and monthly average prices could vary significantly from this forecast because global economic developments and geopolitical events in the coming months have the potential to push oil prices higher or lower than the current Short-Term Energy Outlook (STEO) price forecast.
For example, EIA's forecast for the average WTI price in October 2017 is $48/b, while the options markets indicate an expected range of WTI prices from $36/b to $60/b (at the 95% confidence interval) based on the recent prices of futures and options contracts for October 2017 delivery.
U.S. crude oil production patterns in the Lower 48 onshore basins continue to vary by region, and quickly evolving trends in this sector can affect both current prices and expectations for future prices. However, lasting price movements could be limited over the next year because some U.S. tight oil producers have used financial instruments to guarantee a price above $50/b for their expected production.
Crude oil prices reached their lowest year-to-date levels in late June. Prices fell after EIA reported builds in total U.S. crude oil and petroleum products inventories that were above the five-year average during the weeks ending June 2 and June 9. The build in total U.S. petroleum inventories for the week ending June 2 was the largest for any week since 2008. Rising Libyan and Nigerian production in June also put downward pressure on prices.
EIA forecasts total U.S. crude oil production to average 9.3 million b/d in 2017, up 0.5 million b/d from 2016. In 2018, crude oil production is forecast to rise to an average of 9.9 million b/d. If achieved, 2018 production would be the highest annual average on record, surpassing the previous record of 9.6 million b/d set in 1970. The 2018 forecast is 0.1 million b/d lower than in last month’s STEO because of lower forecast crude oil prices in late 2017 and in 2018.
Forecast Organization of the Petroleum Exporting Countries (OPEC) crude oil production is expected to fall by 0.2 million b/d in 2017, as OPEC members have limited production based on their November 2016 agreement. In May 2017, this agreement was extended through the first quarter of 2018. Uncertainty remains regarding the duration of and adherence to the current OPEC production cuts, which could influence prices in either direction. EIA’s forecast assumes a further extension of the agreement in 2018 but with lesser compliance. Without a further extension of the OPEC agreement, EIA would expect larger inventory builds and lower prices in 2018 than are included in this forecast.
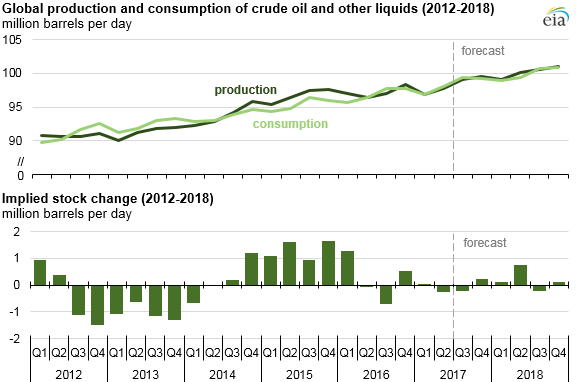
Global liquids consumption growth is expected to be 1.5 million b/d in 2017 and 1.6 million b/d in 2018. In both years, most of this growth (about 1.2 million b/d annually) comes from countries outside of the Organization for Economic Cooperation and Development (OECD), with China and India expected to be the largest contributors to non-OECD liquid fuels consumption growth. Global oil inventories are forecast to be relatively unchanged in the second half of 2017 before returning to average inventory builds of 0.2 million b/d in 2018.
Principal contributors: Matt French, Hannah Breul