U.S. uranium production, prices, and employment all fell in 2016
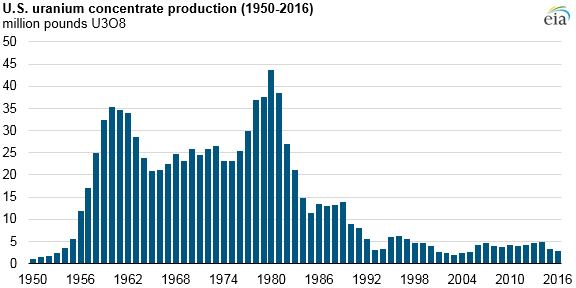
Production of U.S. uranium concentrate decreased 40% between 2014 and 2016 to 2.9 million pounds U3O8 in 2016, the lowest annual total since 2005. Uranium production has been affected by falling uranium prices, with spot prices falling from $34 per pound (lb) in January 2016 to $18/lb in November, the lowest uranium spot price since May 2004.
U.S. production of uranium concentrate, refined from uranium ore, began in 1949 and grew rapidly throughout the 1950s, exceeding 35 million pounds per year by 1960. Production levels remained relatively high through the early 80s, reaching nearly 44 million pounds in 1980. Since 1990, U.S. uranium concentrate production has averaged just over 4 million pounds per year. Domestic nuclear generation now relies heavily on foreign-origin uranium, much of which is enriched domestically. Over the period from 2012 to 2016, foreign-origin uranium made up nearly 90% of uranium purchases by owners and operators of U.S. civilian nuclear power reactors.
Production of uranium concentrate has remained low in 2017, totaling just 0.45 million pounds during the first quarter. If production were to remain at its first-quarter level for the entire year, annual production in 2017 would be the lowest level since 1952.
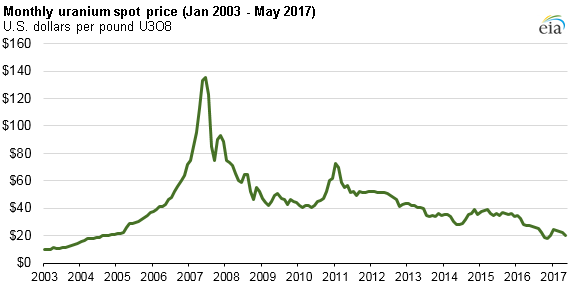
Spot prices for uranium ore fell significantly in 2016, from $34.65/lb in January to $17.75/lb in November, the lowest monthly spot price since May 2004, before increasing to slightly more than $20/lb in December. Prices have remained below $25/lb so far this year. Uranium prices have generally trended downward since their peak of $135/lb in June 2007.
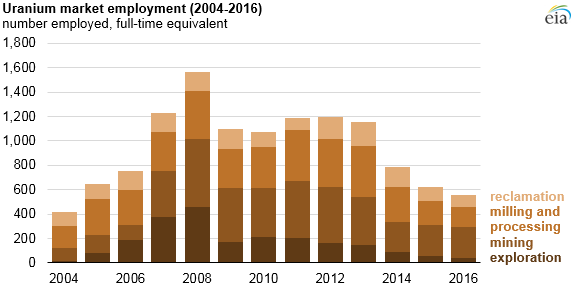
Uranium market employment data, encompassing exploration, mining, milling and processing, and reclamation activities, closely mirrors uranium price movements. Employment increased every year from 2004 to 2008 as uranium prices rose, peaking at 1,563 employees in 2008. Employment levels then began generally falling as uranium prices fell.
Uranium industry employment has now fallen in four consecutive years, from 2012 to 2016, reaching 560 employees in 2016, the lowest number since 2004. Uranium exploration employment has experienced the largest decline, falling from 457 employees in 2008, when uranium prices were considerably higher, to 38 employees in 2016.
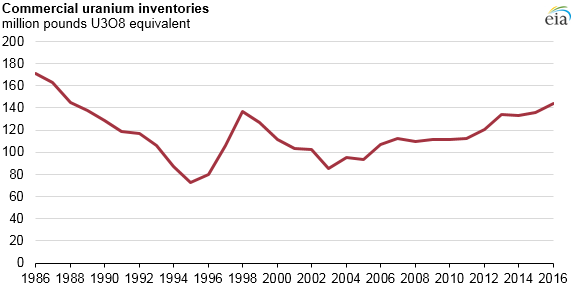
Total commercial uranium inventories continue to build, ending 2016 at 144 million pounds U3O8 equivalent, the highest level since 1988. Inventories have increased in most years since 2003, when commercial uranium inventories totaled 85 million pounds. Commercial inventories are those owned by owners and operators of civilian nuclear power reactors as well as U.S. supplier inventories.
More information about uranium employment, production, and prices is available in EIA’s Uranium Marketing Annual Report.
Principal contributor: Tim Shear
Tags: prices, production/supply, uranium