Wholesale power price maps reflect real-time constraints on transmission of electricity
Republished July 24, 2014 to update a hyperlink.
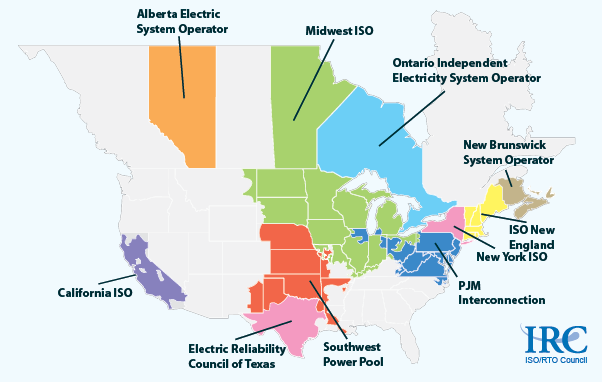
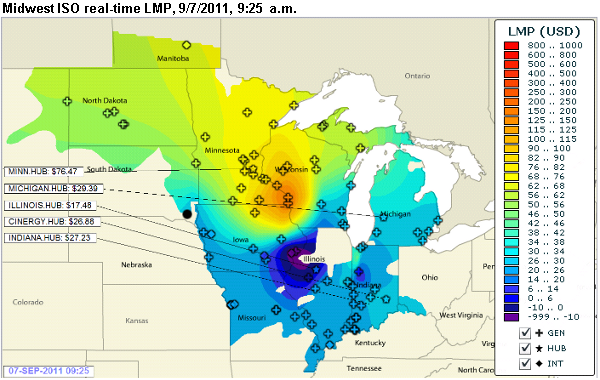
Wholesale electricity prices change throughout the day and night, depending on many factors including the level of demand for electricity and the varying costs of generating power from different types of generators. Wholesale electricity price maps are a useful resource for visualizing location-specific prices and transmission constraints in real time. These maps are created by individual regional transmission organizations (RTOs) for the territory they cover. These maps are updated often, usually every five minutes (see Midwest above).
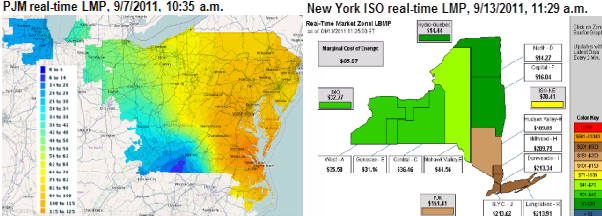
Locational Marginal Prices, or LMPs, are location-specific prices developed within the RTO. LMPs are often higher near load centers like cities, where demand for electric power is concentrated. Significant color changes (i.e., changes in LMP) across a geographic region usually signify a constraint that limits the transmission of electricity from one area to another.
Two common examples of transmission constraints involve moving power from upstate New York into New York City and Long Island (see map below right) and moving power from the west across Pennsylvania and Virginia into the load centers of the eastern cities. The map below left shows the LMP (color) change across the PJM Interconnection (PJM) through Pennsylvania and Virginia, separating the western portion of PJM from the eastern seaboard. PJM operates an electric power system covering all or part of 13 Mid-Atlantic and Midwestern States.
Other factors can influence local real-time prices, for instance a generator outage, a thunderstorm warning, differences in fuel prices, or a difference in temperature across an RTO's territory.
There are many differences among the RTO price maps. Some U.S. RTOs map their prices by zone (ISO New England and New York ISO); by discrete pricing points called nodes (California ISO); or by extending many nodes into a contour map (Midwest ISO, PJM, and Southwest Power Pool), while ERCOT (the system operator for most of Texas) does not currently produce a public map. The New York ISO and ISO New England provide both day-ahead and real-time maps; other RTOs map only real-time prices.
Clicking on a U.S. RTO in the map below will take you to that RTO's price map. Also, each RTO's main website is linked below.