
Flows of gasoline and diesel into the Midwest fall as demand flattens and production grows
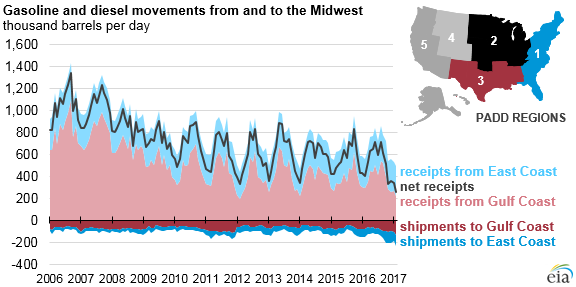
Over the past 10 years, increased refining activity and relatively flat demand in the Midwest—Petroleum Administration for Defense District 2 (PADD 2)—have allowed refiners in the region to meet a larger share of regional gasoline and diesel fuel needs. As a result, shipments of gasoline and diesel into the region have declined, while shipments to other regions have increased. Despite these changes, the Midwest is still a net receiver of gasoline and diesel fuels, especially during summer months and during periods when refineries are undergoing maintenance.
Midwest net receipts of gasoline and distillate (which is mainly ultra-low sulfur diesel) fell from 1.0 million barrels per day (b/d) in 2006 to 500,000 b/d in 2016. The decline in net receipts was driven primarily by a fall in gross receipts from the Gulf Coast (PADD 3), rather than an increase in shipments to other regions. Midwest gross receipts fell 444,000 b/d from 2006 to 2016 compared with a relatively small increase of 79,000 b/d shipped from PADD 2 over the same period. The increase in shipments from the Midwest is largely driven by shipments to the East Coast (PADD 1).
Pipelines are the main mode of shipment between these regions. The primary pipelines connecting the Midwest and Gulf Coast are the Explorer, Magellan, and TEPPCO systems. Over the past 10 years, increasing movements from the Midwest to the Gulf Coast and decreasing movements in the opposite direction reflect increased Midwest self-sufficiency. From 2006 to 2016, movement by pipeline of gasoline and distillate fuels from the Midwest to the Gulf Coast increased by nearly 22,000 b/d (46%), and pipeline shipments in the opposite direction fell by more than 339,000 b/d (48%).
The primary pipelines connecting the Midwest and the East Coast are the Colonial, Plantation, Buckeye, Sunoco, and Marathon systems. From 2006 to 2016, movements of gasoline and distillate by pipeline from the Midwest to the East Coast increased by 41,000 b/d (up from the small base of 3,000 b/d), while movement in the opposite direction fell by 18,000 b/d (6%). The shifting patterns in gasoline and distillate movement have led to an excess of product pipeline capacity, prompting the idling or repurposing of several pipelines in recent years.
In 2013, TEPPCO reversed and repurposed one of their mainline transportation fuel pipelines to carry ethane to the Gulf Coast. TEPPCO no longer delivers fuels on the remaining portion of their south-to-north mainline beyond eastern Indiana. In addition, both TEPPCO and Explorer Pipelines are using excess pipeline capacity to ship condensate to western Canada for use as a diluent in oil sands production.
The Centennial Pipeline has essentially been idle since mid-2011, and its operators are considering reversing and repurposing the pipeline. The recently added Sunoco Allegheny Access pipeline has helped facilitate movement from the Midwest to the East Coast, and the proposed reversal of the Laurel pipeline, part of the Buckeye system, could allow further increases in the flow of products into the East Coast.
For more information about petroleum product flows to and from the Midwest, see EIA’s This Week in Petroleum.
Principal contributor: Matthew French
Tags: diesel, gasoline, liquid fuels, Midwest