U.S. crude oil imports increased in 2016
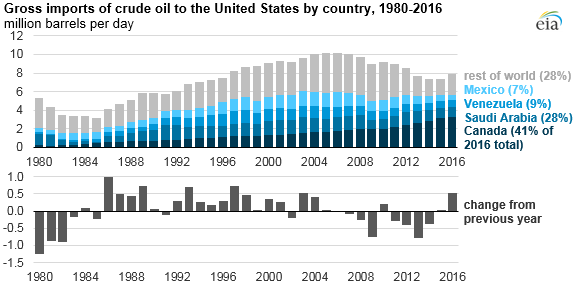
Gross U.S. crude oil imports in 2016 rose to an average of 7.9 million barrels per day (b/d), 514,000 b/d more than the 2015 average. Net crude oil imports increased by a smaller amount (460,000 b/d), as U.S. crude oil exports rose despite a decline in U.S. crude oil production. From a longer term perspective, gross crude oil imports in 2016 were still 22% lower than their 2005 high of 10.1 million b/d. Crude oil imports have also been affected by other major changes since 2005, when the United States was the world’s largest net importer of refined products and crude oil. In 2016, the United States was the world’s largest net exporter of refined products, with a significant portion of crude oil input to U.S. refiners supporting those exports.
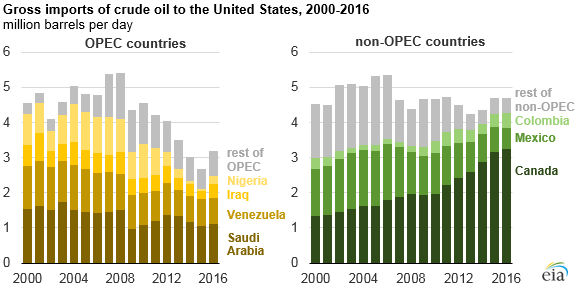
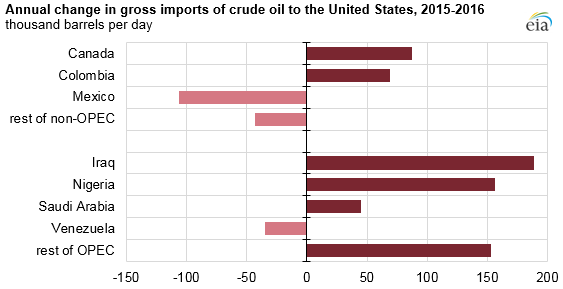
Canada continued to be the largest source of U.S. crude oil imports in 2016, providing a record 3.3 million b/d, or 41% of total U.S. imports—more than all Organization of the Petroleum Exporting Countries (OPEC) combined. Among non-OPEC suppliers, 2016 marked the seventh consecutive year of increasing crude oil imports from Canada and the sixth consecutive year of decreasing crude oil imports from Mexico. Imports from Mexico have declined as Mexico’s crude oil production, its total crude export sales, and the share of its exports sold in the United States have all fallen. Increased U.S. imports of heavy Canadian crude oils are replacing some imported Mexican crude oils of similar quality. Canada’s share of U.S. crude oil imports declined slightly from 2015, as both imports and import shares from countries such as Iraq and Nigeria grew, according to annual trade data from EIA's Petroleum Supply Monthly.
OPEC supplied 40% of the crude oil imported to the United States in 2016, up slightly from 36% in 2015. Nevertheless, OPEC’s share in 2016 was lower than in any year between 1973, the earliest year for which EIA has country-specific crude oil import data, and 2014.
Note: OPEC is the Organization of the Petroleum Exporting Countries.
Imported crude oil from Iraq and Nigeria were the largest contributors to the increase in U.S. crude oil imports in 2016. Imports from Iraq increased from 229,000 b/d in 2015 to 418,000 b/d in 2016, and imports from Nigeria increased from 54,000 b/d to 210,000 b/d. Nigerian crude oil is of similar quality to that produced in the Bakken region in parts of North Dakota and Montana. As production in the Bakken region (and the United States as a whole) declined, refiners may have increased imports from Nigeria to replace these barrels.
Note: OPEC is the Organization of the Petroleum Exporting Countries.
Principal contributors: Owen Comstock, Matthew French
Tags: Canada, crude oil, exports/imports, international, Iraq, liquid fuels, Mexico, Nigeria, oil/petroleum, OPEC, Saudi Arabia