
Another type of crude oil to be included in calculation of the Brent price benchmark
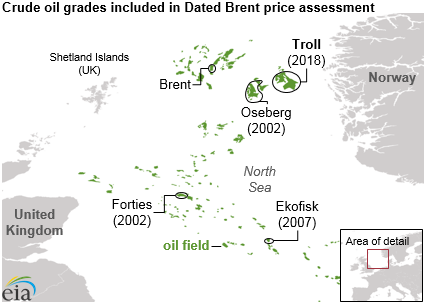
The method for assessing the Brent global benchmark crude oil price is scheduled to change in 2018. The Brent price benchmark reflects transactions involving physical cargoes of several specific grades of crude oil in the North Sea, located between the United Kingdom and Norway. Declining production of some of the four North Sea crude oil grades currently used to calculate the Brent benchmark has prompted the price reporting agency, Platts, to announce that cargoes of Norway’s Troll crude oil will be included in its Brent price assessment beginning in 2018.
Offshore crude oil pipeline and transportation infrastructure systems often blend crude oil produced by several different fields into one stream, or grade, of crude oil. The crude oil marketed and sold from the system often takes the name of the most prominent field. The Brent oil field that the benchmark is named for is located in the United Kingdom territorial waters of the North Sea between the Shetland Islands and Norway. The Brent field was discovered in 1972, and production from Brent began in 1976.
In the 1980s, Platts began using transactions of physical cargoes of Brent-grade crude oil to serve as its benchmark for the price of physical crude oil cargoes with specific loading dates in the North Sea. This price assessment is known as Dated Brent. In 1988, the physical market for Brent crude oil became the underlying basis for the Intercontinental Exchange (ICE) Brent futures contract. These prices—both Dated Brent and Brent ICE futures contracts—are used in many financial and trading arrangements and often serve as the basis of comparison for crude oil prices around the world.
As crude oil production from the Brent field declined from the peak level of 504,000 barrels per day (b/d), reached in 1982, fewer Brent cargoes were available for trade. The decrease in cargoes reduced the liquidity of the Dated Brent price assessment, making transactions more difficult. In 2002, Platts responded by including transactions involving two additional grades of crude oil, Forties from the United Kingdom and Oseberg from Norway, in its price assessment for North Sea oil. In 2007, Platts added the Norwegian crude oil grade Ekofisk. Since then, the Dated Brent crude oil price assessment has also been referred to as Brent BFOE, with the acronym representing the four crude oil grades included in the assessment.
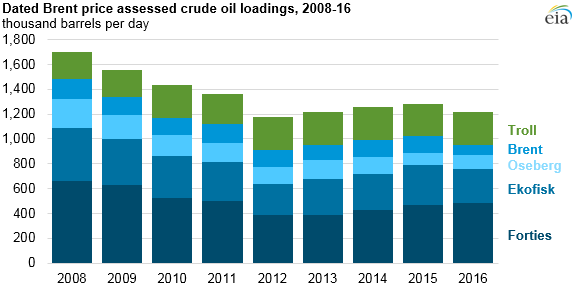
With continued production declines in the North Sea, annual combined cargo loadings of the four BFOE crude oil grades fell from more than 1.4 million b/d in 2006 to less than 1 million b/d by 2012. Production and loadings increased slightly from 2013 through 2015, as investments made during periods of high oil prices from 2011 through 2014 were completed. By 2015, total BFOE crude oil grade loadings reached 1.03 million b/d, but a year later they had fallen to 948,000 b/d.
Based on 2016 loadings, including Norwegian grade Troll—named after the Troll field about 40 miles off the coast of Norway—will add about 29% more crude oil volume to the current Dated Brent (BFOE) price assessment. With the inclusion of Troll, total loadings of the Dated Brent (BFOET) assessed crude oil grades would be 1.2 million b/d in 2016.
Despite the continuing importance of the Brent price benchmark, actual crude oil production from the original Brent field will soon end after more than 40 years of production. Shell, the operator of the Brent field, has begun to decommission and remove the offshore oil platforms and the 154 wells associated with the field.
Principal contributor: Mason Hamilton